A
B
C
D
Text Solution
Verified by Experts
The correct Answer is:


Topper's Solved these Questions
Similar Questions
Explore conceptually related problems
NTA MOCK TESTS-JEE MOCK TEST 24-PHYSICS
- Which of these materials requires the least value of magnetic field st...
Text Solution
|
- A current of 2A flows through a 2 Omega resistor when connected across...
Text Solution
|
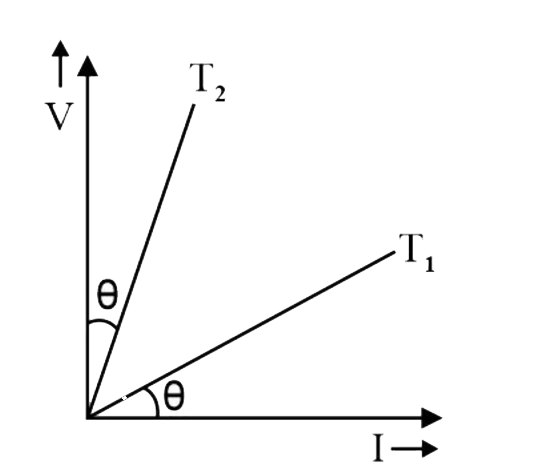
- The V - I graphs for a conductor at temperature T1 and T2 are shown in...
Text Solution
|
- A superconducting loop of radius R has self inductance L, A uniform & ...
Text Solution
|
- A solid sphere of radius R has a charge Q distributed in its volume wi...
Text Solution
|
- Two balls with equal charge are in a vessel with ice at - 10 ^@C at a ...
Text Solution
|
- A circular coil of radius R carries a current i. The magnetic field at...
Text Solution
|
- A Carnot engine, having an efficiency of eta= 1/10 as heat engine, is ...
Text Solution
|
- Two bodies of specific heats s1 and s2 having same heat capacities are...
Text Solution
|
- The phase difference between two points separated by 0.8 m in a wave o...
Text Solution
|
- Three blocks are arranged on a horizontal table ABCD as shown in the f...
Text Solution
|
- Two gold pieces, each of mass 0.035 g are placed in a box of mass 2.3 ...
Text Solution
|
- A small smooth disc of mass m and radius moving with an initial veloci...
Text Solution
|
- A conical portion of radius R and height H is removed from the bottom ...
Text Solution
|
- A spherical ball of density rho and radius 0.003m is dropped into a tu...
Text Solution
|
- A spool of mass M and radius 2R lies on an inclined plane as shown in ...
Text Solution
|
- A carrier wave of peak voltage 12 V is used to transmit a message sign...
Text Solution
|
- The 6 V Zener diode shown in the figure has negligible resistance and ...
Text Solution
|
- For a material medium, the values of refractive index for violet and c...
Text Solution
|
- A ray of light is incident from a denser to a rarer medium. The critic...
Text Solution
|