A
B
C
D
Text Solution
Verified by Experts
The correct Answer is:


Topper's Solved these Questions
SOUND WAVES
MOTION|Exercise Exercise - 2|41 VideosSOUND WAVES
MOTION|Exercise Exercise - 3 (Section - A)|27 VideosSOUND WAVES
MOTION|Exercise Questions for practice|12 VideosSIMPLE HARONIC MOTION
MOTION|Exercise EXERCISE -4 (Leve-II) [ JEE 2011]|11 VideosSURFACE TENSION
MOTION|Exercise Exercise - 3 | Section - B Previous Year Problems | AIEEE|12 Videos
Similar Questions
Explore conceptually related problems
MOTION-SOUND WAVES-Exercise - 1
- The velocity of longitudinal waves in solid, is given by (where symbol...
Text Solution
|
- The densities of two monoatomic gases are in the ratio of 16:9. The ve...
Text Solution
|
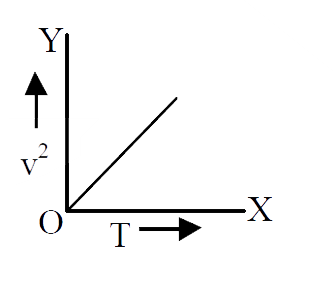
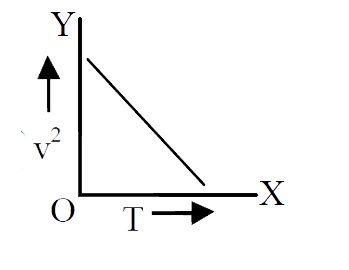
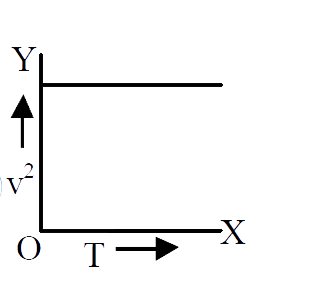
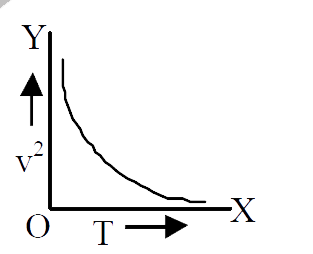
- The correct graph between v^(2) (square of the speed of sound) and ab...
Text Solution
|
- Voice of a child is more shrill than that of an elderly person because...
Text Solution
|
- The terms pitch, quality and loudness of sound are associated with the...
Text Solution
|
- In an orchestra, the musical sounds of different instruments are disti...
Text Solution
|
- In the stationary waves in an open organ pipe -
Text Solution
|
- In open pipes, the positions of antinodes are obtained at
Text Solution
|
- Modes of vibration in an open organ pipe are represented by –
Text Solution
|
- In closed pipes, the positions of antinodes are obtained at –
Text Solution
|
- Modes of vibration in a closed organ pipe are represented by –
Text Solution
|
- The first overtone of a closed pipe is given by –
Text Solution
|
- The frequency of an open organ pipe is n. If one of its ends is closed...
Text Solution
|
- In an open organ pipe, if the fundamental frequency is n, the overtone...
Text Solution
|
- An open pipe of length 33cm resonates with frequency of 1000Hz. If the...
Text Solution
|
- The velocity of sound in air is 333 m//s . The length of an open pipe,...
Text Solution
|
- The length of an open pipe is 48 cm and its fundamental frequency is 3...
Text Solution
|
- The ratio of the lengths of two closed pipes is 31// 30 . Their fundam...
Text Solution
|
- The length of an open pipe is 0.5m and the velocity of sound in air is...
Text Solution
|
- Velocity of sound in air is 332 m//sec . The shortest length of an ope...
Text Solution
|