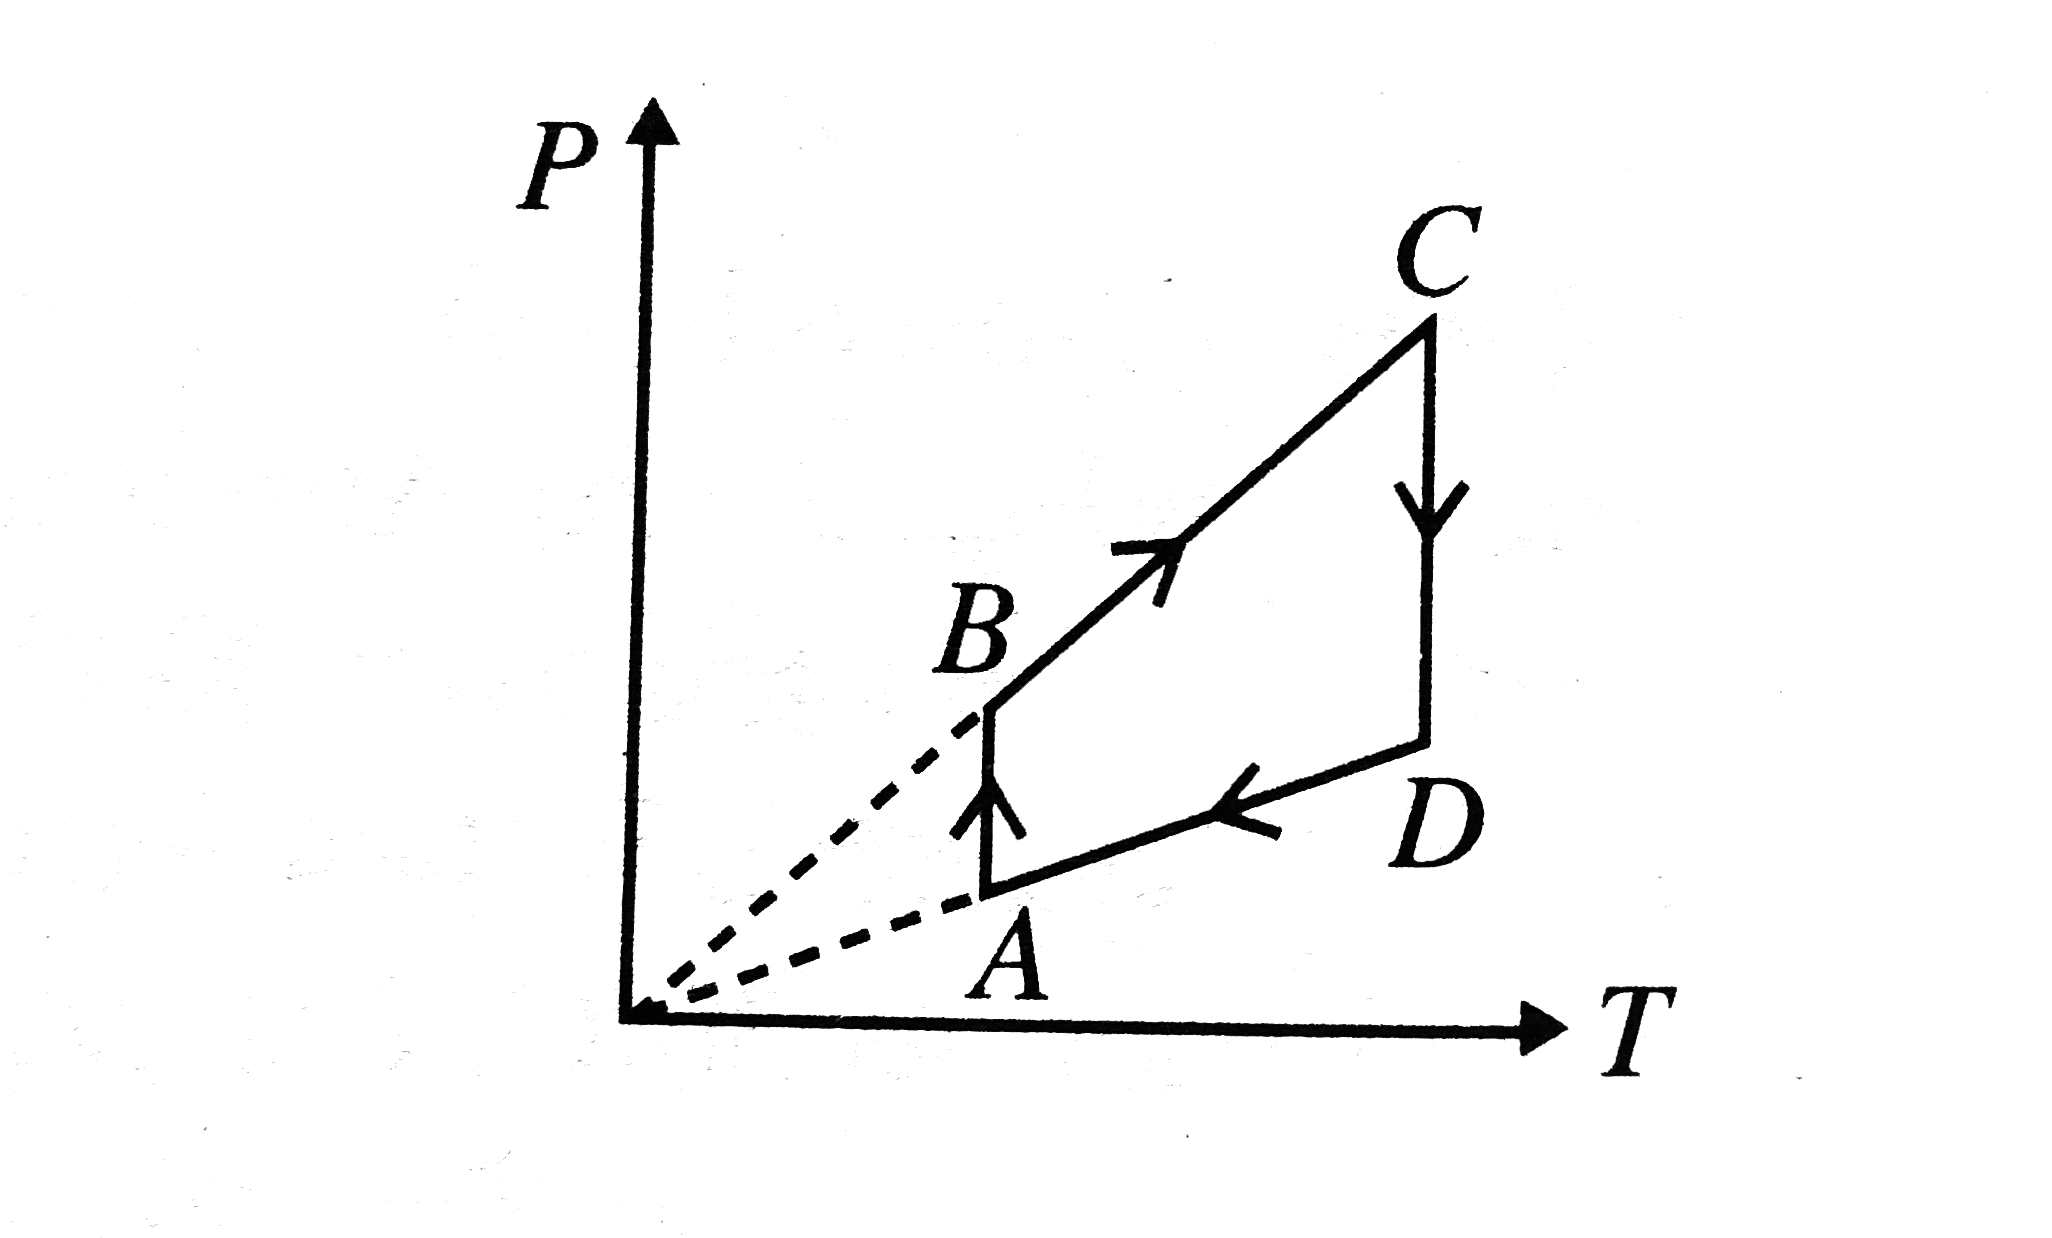
A
B
C
D
Text Solution
Verified by Experts
The correct Answer is:


Topper's Solved these Questions
Similar Questions
Explore conceptually related problems
CAREER POINT-UNIT TEST 5-PHYSICS
- At what temperature the Fahrenheit and kelvin scales of temperature gi...
Text Solution
|
- 70 calories of heat required to raise the temperature of 2 moles of an...
Text Solution
|
- 2kg of ice at 20^@C is mixed with 5kg of water at 20^@C in an insulati...
Text Solution
|
- Two identical glass bulbs are interconnected by a thin glass tube. A g...
Text Solution
|
- Work done by a system under isothermal change from a volume V(1) to V(...
Text Solution
|
- If one mole of a monoatomic gas (gamma=5//3) is mixed with one mole of...
Text Solution
|
- For gas at a temperature T the root-mean-square speed v(rms), the most...
Text Solution
|
- At constant temperature on increasing the pressure of a gas by 5% wil...
Text Solution
|
- A gas is expanded from volume V(0) = 2V(0) under three different proce...
Text Solution
|
- A gas is expanded to double its volume by two different processes. One...
Text Solution
|
- Pressure versus temperature graph of an ideal gas as shown in Fig. C...
Text Solution
|
- In the following P-V diagram two adiabatics cut two isothermals at tem...
Text Solution
|
- An ideal heat engine has an efficiency eta. The cofficient of performa...
Text Solution
|
- Six identical cunducting rods are joined as shown in Fig. Points A and...
Text Solution
|
- A ring consisting of two parts ADB and ACB of same conductivity k carr...
Text Solution
|
- The temperature of a body is increased by 50%. The amount of radiation...
Text Solution
|
- A body cools from 60^(@)C to 50^(@)C in 10 minutes when kept in air at...
Text Solution
|
- A pendulum clock is 5 sec. Slow at a temperature 30^(@)C and 10 sec. ...
Text Solution
|
- Driver of a truck gets his steel petrol tank filled with 75 L of petr...
Text Solution
|
- The coefficient of linear expansion of crystal in one direction is alp...
Text Solution
|