Text Solution
Verified by Experts
The correct Answer is:


Topper's Solved these Questions
STATES OF MATTER : GASES AND LIQUIDS
DINESH PUBLICATION|Exercise Multiple Choice Question (Select the correct Answer)|13 VideosSTATES OF MATTER : GASES AND LIQUIDS
DINESH PUBLICATION|Exercise Assignment (Very Short Answer Question)|24 VideosSTATES OF MATTER : GASES AND LIQUIDS
DINESH PUBLICATION|Exercise Practice|40 VideosSTATES OF MATTER (SOLID STATE CHEMISTRY)
DINESH PUBLICATION|Exercise ULTIMATE PREPARATORY PACKAGE|21 VideosSTRUCTURE OF ATOM
DINESH PUBLICATION|Exercise Reason Type Questions|1 Videos
Similar Questions
Explore conceptually related problems
DINESH PUBLICATION-STATES OF MATTER : GASES AND LIQUIDS-Multiple Choice Question
- As the temperature increases, average kinetic energy of molecules incr...
Text Solution
|
- Gases posses characteristic critical temperature which depends upon th...
Text Solution
|
- What is SI unit of viscosity coefficient (eta) ?
Text Solution
|
- Atmospheric pressure recorded in different citie are as follows {:("...
Text Solution
|
- Which curve in figure represents the curve of ideal gas ?
Text Solution
|
- Increase in kinetic energy can overcome intermolecular forces of attra...
Text Solution
|
- How does the surface tension of a liquid vary with increase in tempera...
Text Solution
|
- With regard to the gaseous state of matter which of the following stat...
Text Solution
|
- Which of the following figures does not represent 1 mole of dioxygen g...
Text Solution
|
- Under which of the following conditions applied together, a gas deviat...
Text Solution
|
- Which of the following changes decrease the vapour pressure of water k...
Text Solution
|
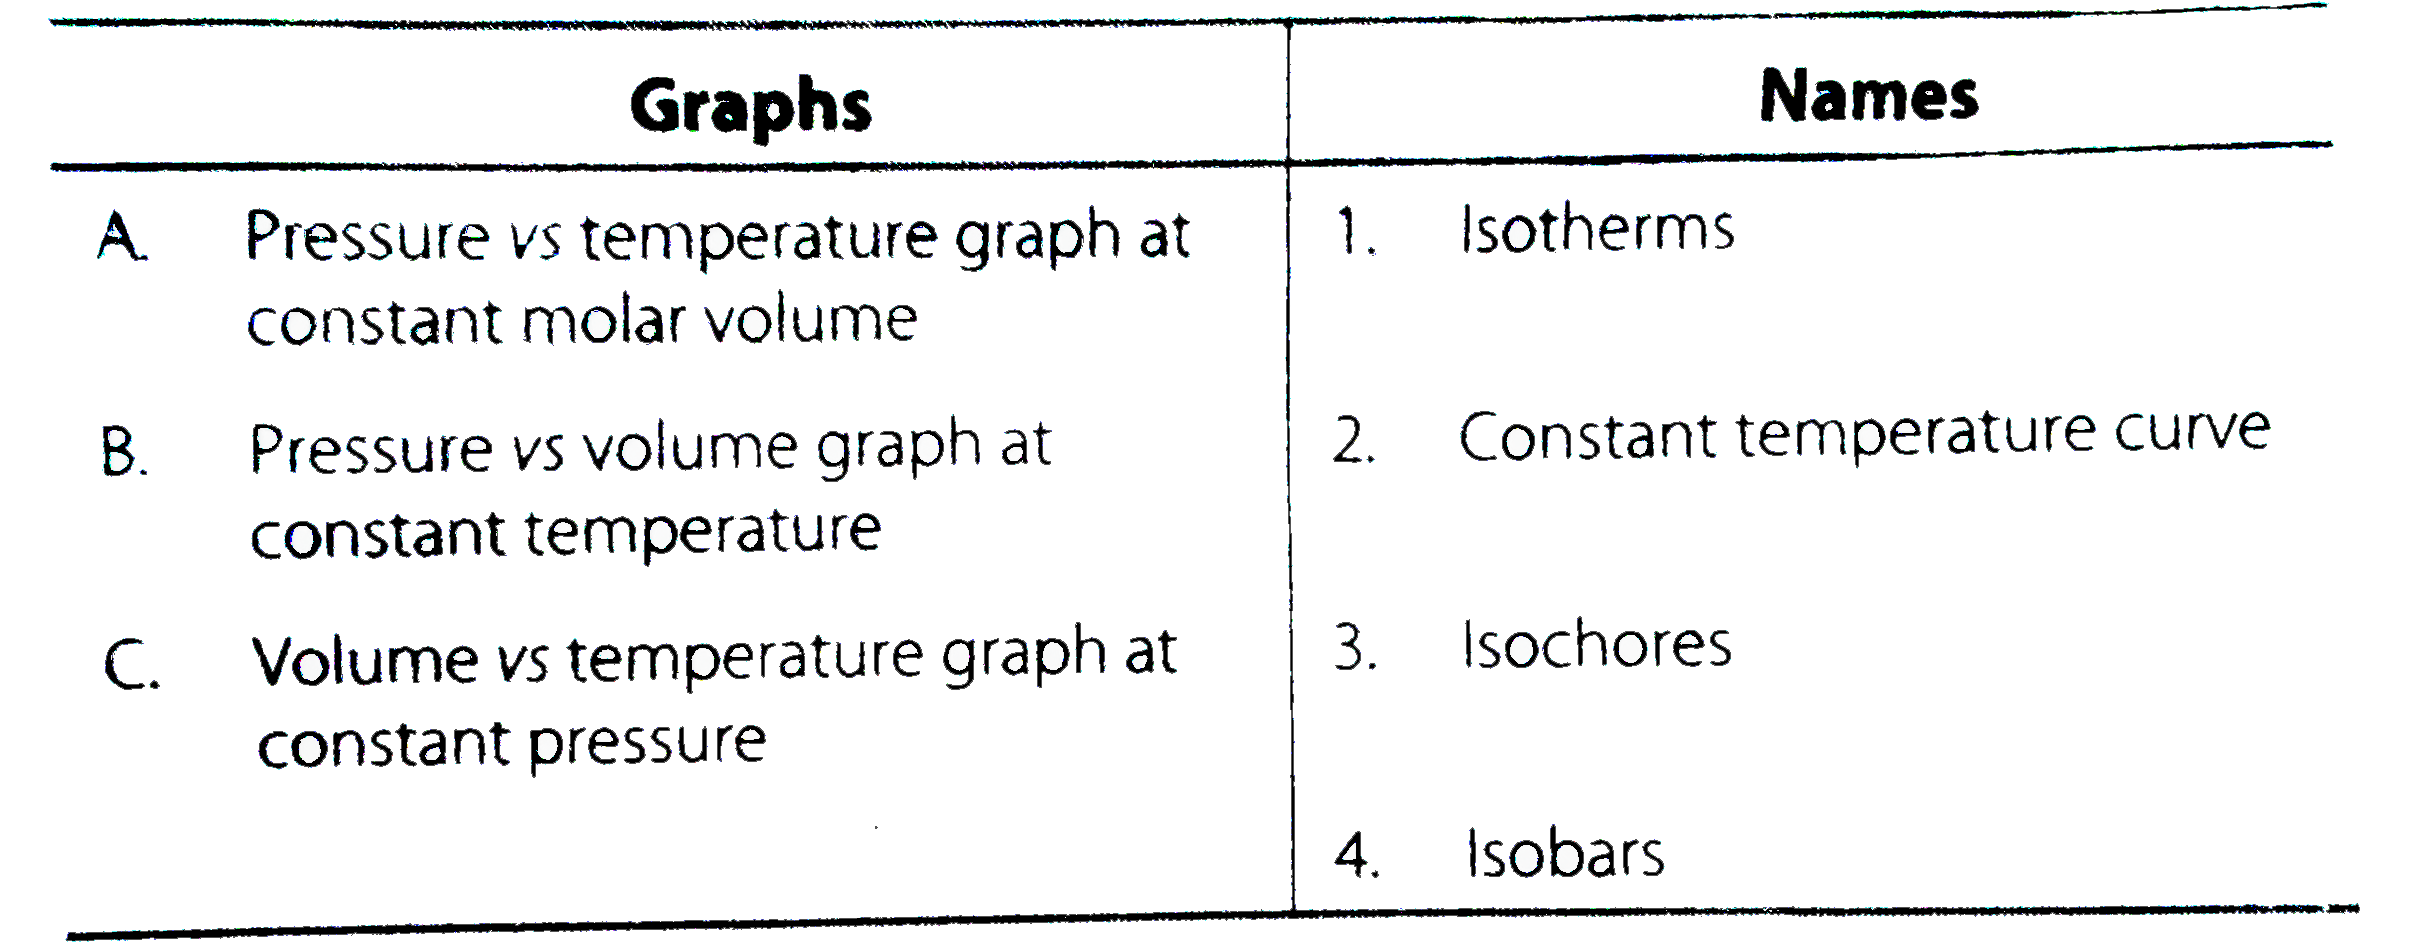
- Match the graphs between the following variables with their names.
Text Solution
|
- Match the following gas laws with the equation representing them.
Text Solution
|
- Match the following graphs of ideal gas with their coordinates.
Text Solution
|
- Assertion (A) Three states of matter are the result of balance between...
Text Solution
|
- Assertion :- At constant temperature PV vs V plot for real gas is not ...
Text Solution
|
- Assertion (A) The temperature at which vapour pressure of a liquid is ...
Text Solution
|
- Assertion (A) Gases do not liquefy above their critical temperature, e...
Text Solution
|
- Assertion (A) At critical temperature liquid passes into gaseous state...
Text Solution
|
- Assertion (A) Liquids tend to have maximum number of molecules at thei...
Text Solution
|