A
B

C
D
Text Solution
Verified by Experts
The correct Answer is:


Topper's Solved these Questions
MOTION IN A STRAIGHT LINE
NCERT EXEMPLAR|Exercise Multiple Choice Question (More Than One Qns)|6 VideosMOTION IN A STRAIGHT LINE
NCERT EXEMPLAR|Exercise Very Short Answer Type Qns|14 VideosMOTION IN A PLANE
NCERT EXEMPLAR|Exercise Multiple Choice Questions|37 VideosOSCILLATIONS
NCERT EXEMPLAR|Exercise MULTIPLE CHOICE QUESTIONS (MCQs)|40 Videos
Similar Questions
Explore conceptually related problems
NCERT EXEMPLAR-MOTION IN A STRAIGHT LINE -Very Short Answer Type Qns
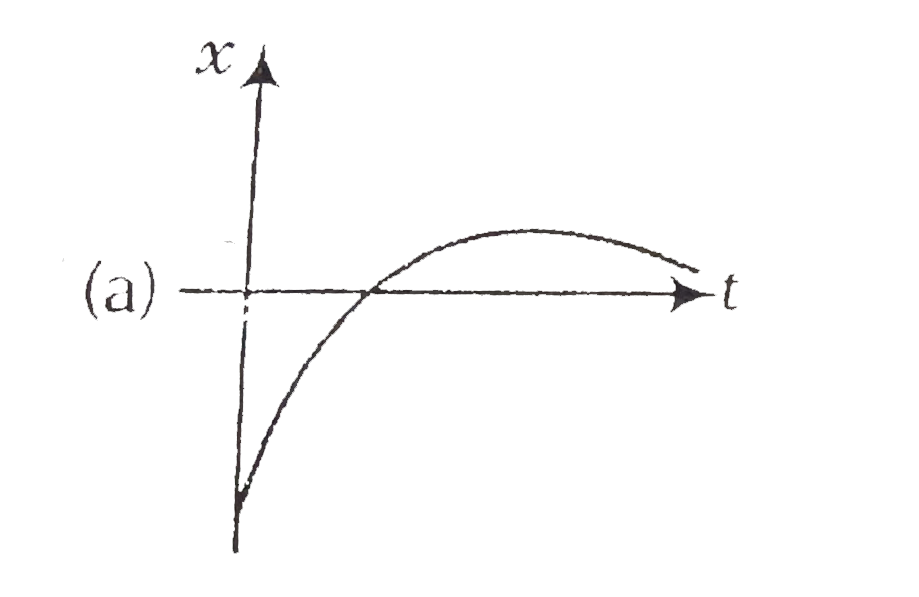
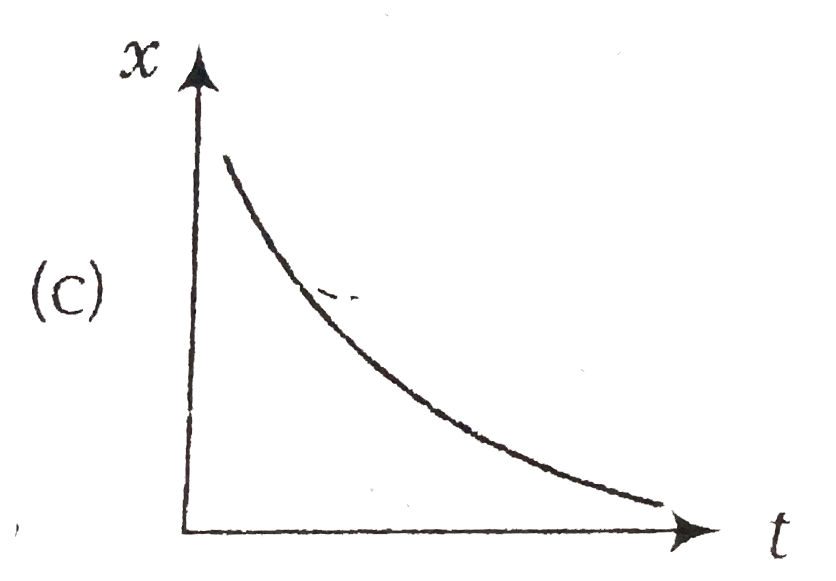
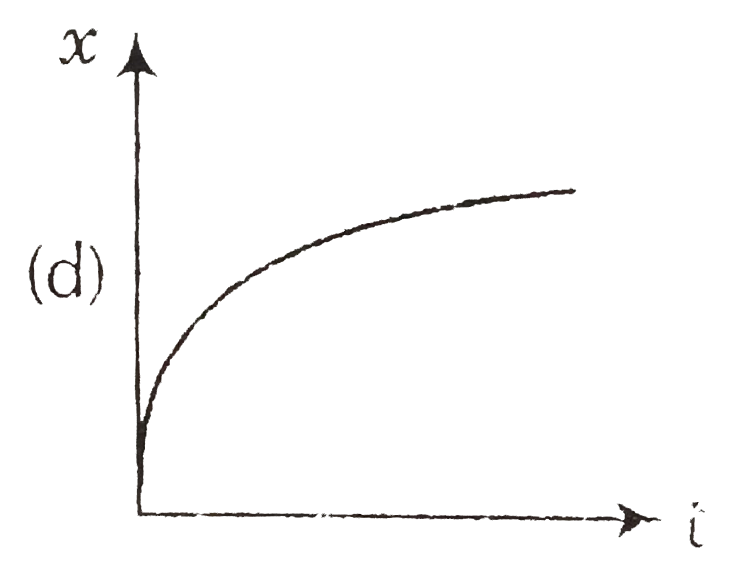
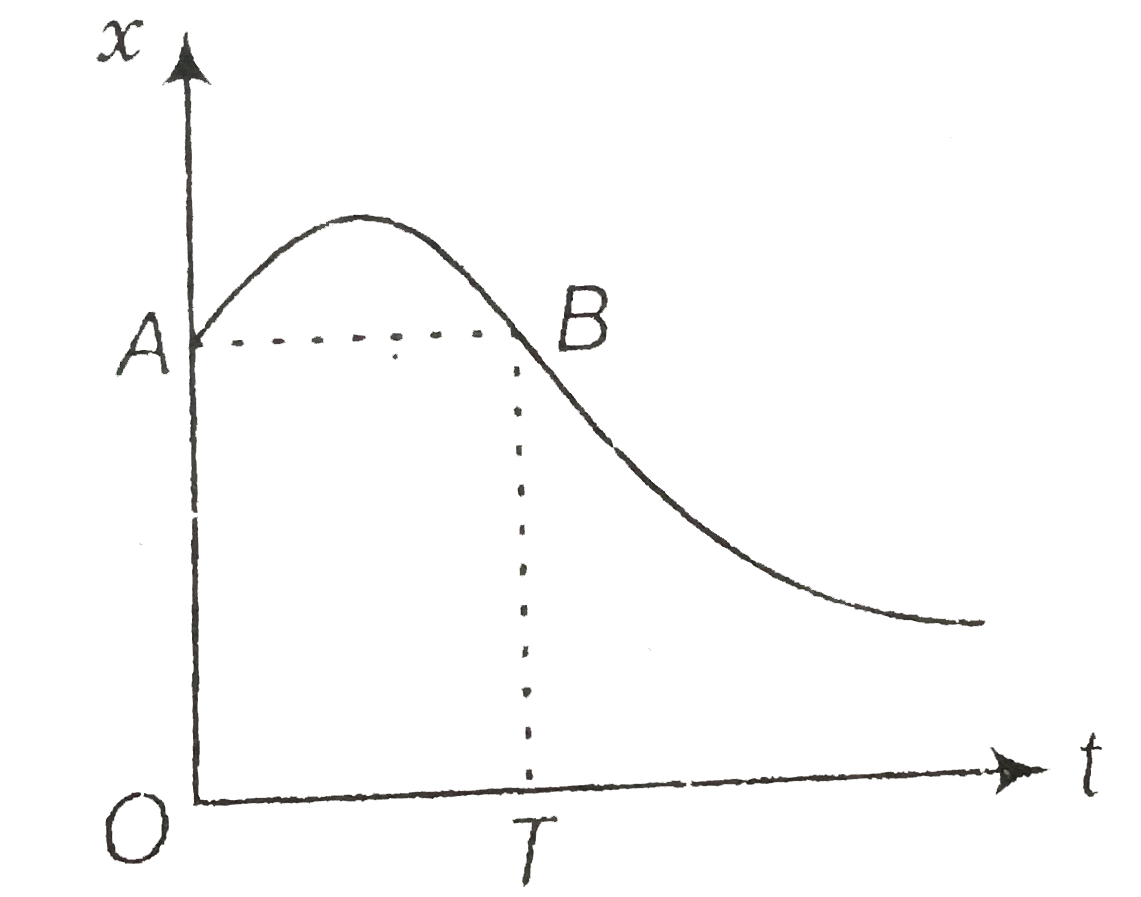
- Among the four graphs shown in the figure there is only one graph for ...
Text Solution
|
- A uniform moving cricket ball is turned back by hitting it with a bat ...
Text Solution
|
- Give examples of a one-dimensional motion where (a) the particle mo...
Text Solution
|
- Give example of a motion where x gt 0, vlt 0, agt at a particular in...
Text Solution
|
- An object falling through a fluid is observed to have acceleration giv...
Text Solution
|
- A ball is dropped and its displacement vs time graph is as shown in Fi...
Text Solution
|
- A particle executes the motion described by x (t)=x(0) (1-e^(-gamma t)...
Text Solution
|
- A bird is tossing (flying to and fro) between two cars moving towards ...
Text Solution
|
- A man runs across the roof-top of a tall building and jumps horizontal...
Text Solution
|
- A ball A is dropped from a building of height 45 m. Simultaneously a...
Text Solution
|
- The velocity-displacement graph of a particle is shown in Fig . (a) Wr...
Text Solution
|
- It is a common observation that rain clouds can be at about a kilomet...
Text Solution
|
- A motor car moving at a speed of 72 km //h can not come to a stop in ...
Text Solution
|
- A monkey climbs up a slippery pole for 3 seconds and subsequently sli...
Text Solution
|
- A man is standing on top of a building 100 m high. He throws two ball ...
Text Solution
|