Text Solution
Verified by Experts


Similar Questions
Explore conceptually related problems
Recommended Questions
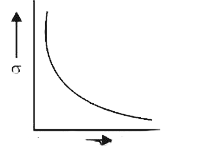
- Explain with the help of graph the variation of conductivity with temp...
Text Solution
|
- With increase in temperature the electrical conduction of metallic con...
Text Solution
|
- On increasing temperature, conduction in metallic conductors
Text Solution
|
- Explain with the help of graph the variation of conductivity with temp...
Text Solution
|
- धात्वीय चालक के लिए ताप के साथ चालकता में परिवर्तन की व्याख्या ग्राफ क...
Text Solution
|
- Explain the variation of conductivity with temperature for ionic condu...
Text Solution
|
- ग्राफ की सहायता से समझाइए कि धात्विक चालक की चालकता ताप के साथ कैस...
Text Solution
|
- Write a note on the variation of resistance of a metallic conductor wi...
Text Solution
|
- Explain how does the conductivity of a : (i) Metallic conducto...
Text Solution
|