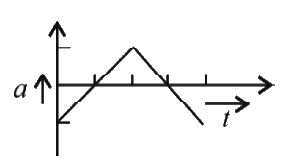
A
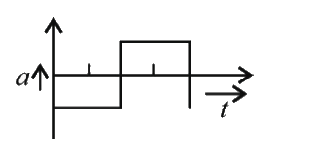
B
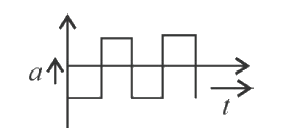
C
D
Text Solution
Verified by Experts
The correct Answer is:


Similar Questions
Explore conceptually related problems
Recommended Questions
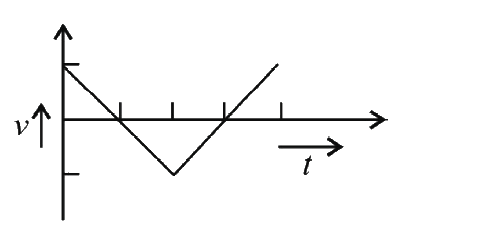
- The graph in figure shows the velocity v versus time t for a body. Whi...
Text Solution
|
- The acceleration versus time graph of a particle is shown in the figur...
Text Solution
|
- Velocity versus displacement graph of a particle moving in a straight ...
Text Solution
|
- The graph of displacement versus time is shown. Its corresponding velo...
Text Solution
|
- Velocity versus displacement graph of a particle moving in a straight ...
Text Solution
|
- The graph below shws the velocity versus time graph for a body Wh...
Text Solution
|
- A particle starts to move along a straight line. The acceleration vers...
Text Solution
|
- Velocity (v) versus displacement (s) graph of a particle moving in a s...
Text Solution
|
- Velocity versus time graph of a body is shown in figure. It explains t...
Text Solution
|