Text Solution
Verified by Experts


Topper's Solved these Questions
CBSE EXAMINATION PAPER, DELHI REGION - 2015 (CODE NO. 55/1/1/D)
CBSE COMPLEMENTARY MATERIAL|Exercise SECTION B|6 VideosCBSE EXAMINATION PAPER, DELHI REGION - 2015 (CODE NO. 55/1/1/D)
CBSE COMPLEMENTARY MATERIAL|Exercise SECTION C|15 VideosCBSE Examination Paper Delhi–2014
CBSE COMPLEMENTARY MATERIAL|Exercise SET-III (Questions Uncommon to set-I and II)|9 VideosDUAL NATURE OF MATTER AND RADIATION & ATOMS AND NUCLEI
CBSE COMPLEMENTARY MATERIAL|Exercise Long Answer Question|22 Videos
Similar Questions
Explore conceptually related problems
CBSE COMPLEMENTARY MATERIAL-CBSE EXAMINATION PAPER, DELHI REGION - 2015 (CODE NO. 55/1/1/D)-SECTION E
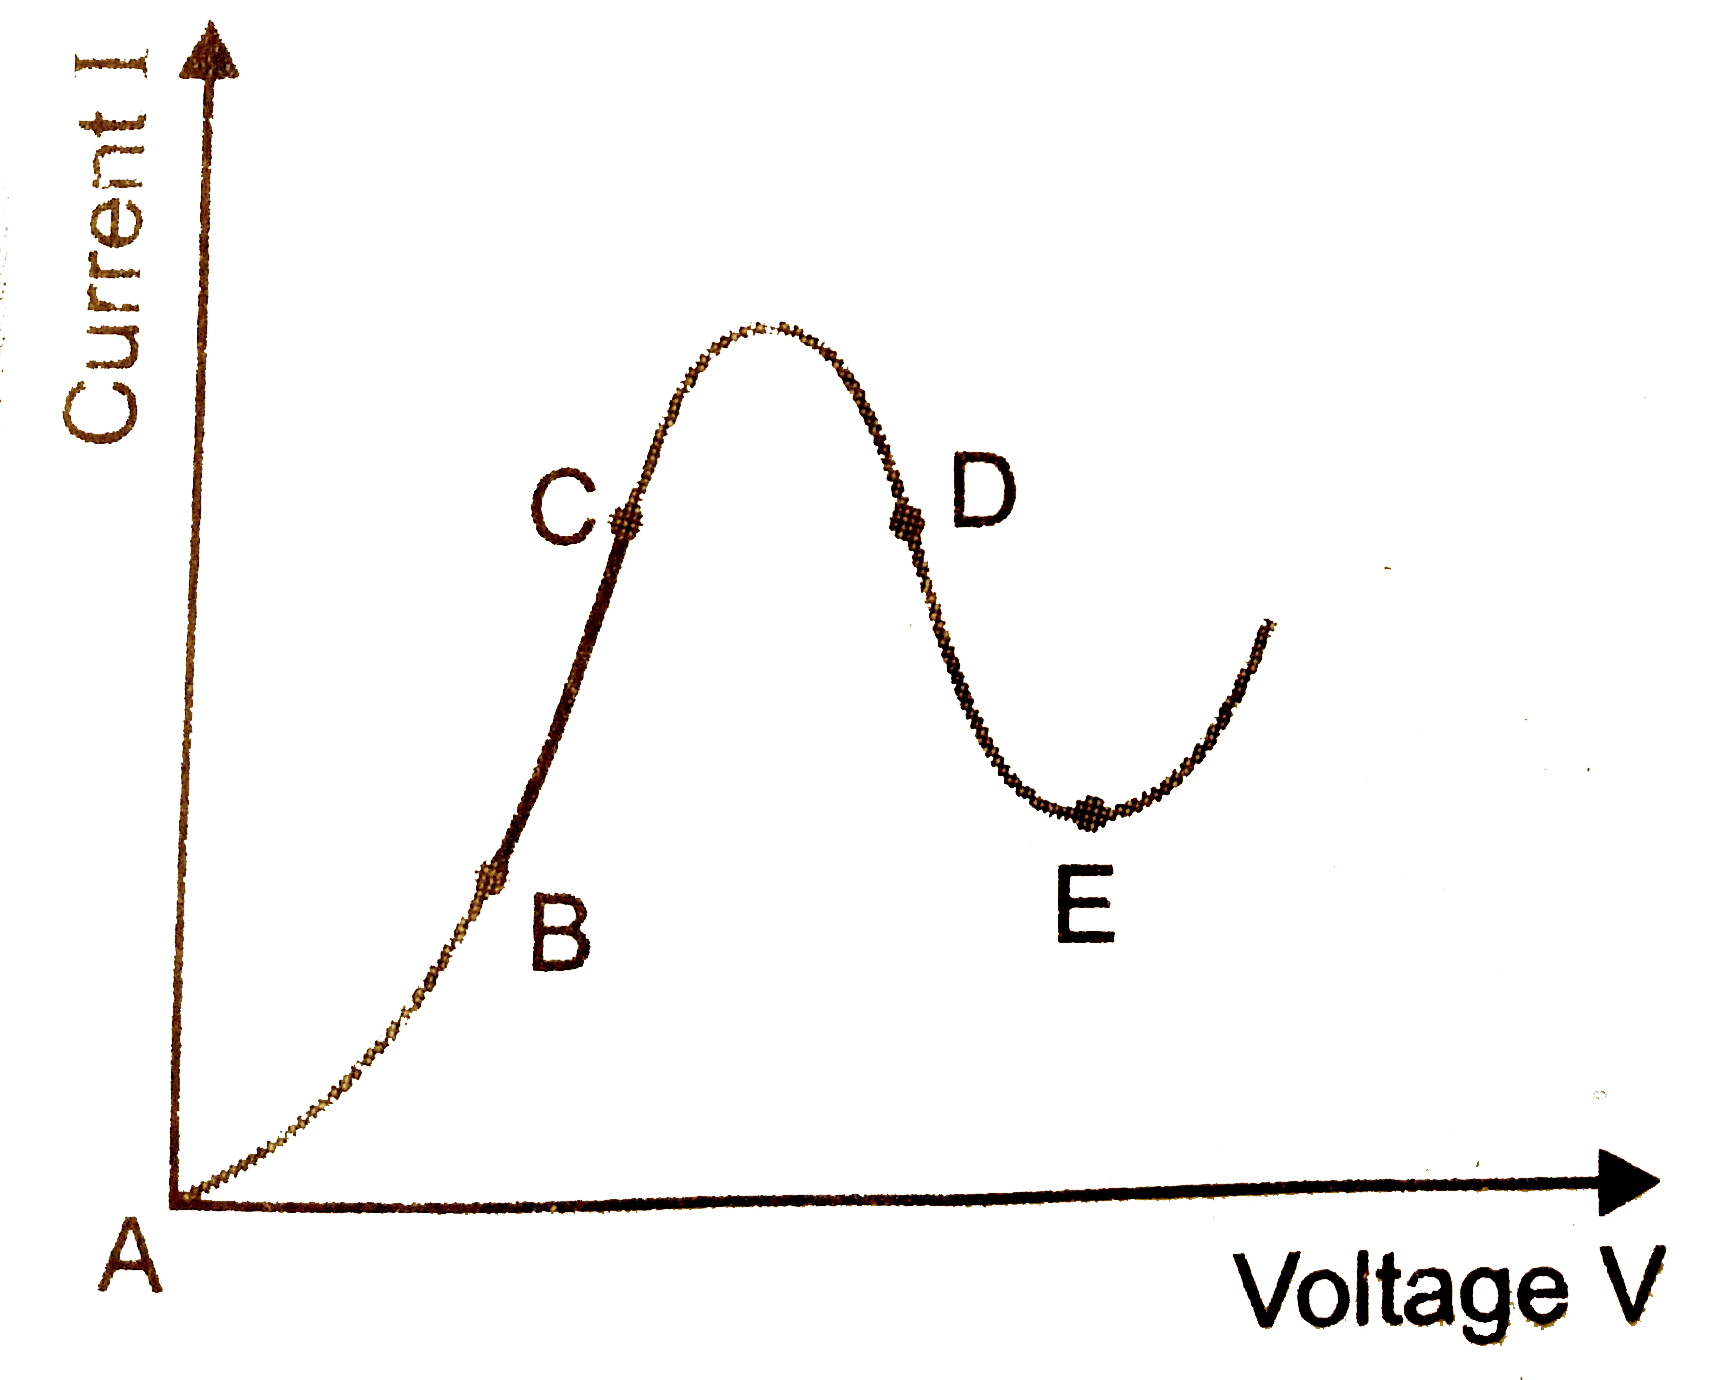
- Graph showing the variation of current versus voltage for a material G...
Text Solution
|
- State Ampere's circuital law. Use this law to obtain the expression fo...
Text Solution
|
- An observer to the left of a solenoid of N turns each of cross section...
Text Solution
|
- Define mutual inductance and write its S.I. units.
Text Solution
|
- Write an expression for mutual inductance of two co-axial solenoids.
Text Solution
|
- An electric dipole of dipole moment vec(p) consists of point charges ...
Text Solution
|
- Given the electric field in the region vec(E ) = 2xi, find the net ele...
Text Solution
|