Home
Class 12
BIOLOGY
The graph shows the effect of temperatur...

The graph shows the effect of temperature on the rate at which the enzyme in a biological washing powder digests and removes fruit juice stains .

Which statements explain the shape of the graph at temperatures higher than X ?
I. Bonds are broken between the R groups of the amino acids in the polypeptide chains of the enzyme.
II. There are more collisions between the enzyme and its substrate.
III. The tertiary structure of the enzyme is altered.
Iv. The shapes of the active site and the substrate are no longer complementary .

A

I,II and III

B

I,II and IV

C

I,III and IV

D

II,III and IV

Text Solution

Verified by Experts

The correct Answer is:
C
Promotional Banner

Topper's Solved these Questions

  • NTA NEET SET 32

    NTA MOCK TESTS|Exercise BIOLOGY|90 Videos
  • NTA NEET SET 34

    NTA MOCK TESTS|Exercise BIOLOGY|90 Videos

Similar Questions

Explore conceptually related problems

A new amino acid in a polypeptide chain is added at

Peptide bonds are formed between which group of amino acids?

Optimum temperature is the temperature at which and enzyme

Optimum temperature is the temperature at which an enzyme

The given graph shows the effect of substrate concentration on the rate of reaction of the enzymes green gram-phosphatase. What does the graph indicate ?

From the following, the statement /s that will help to determine the specificity of an enzyme is /are: I. The bonding between R groups of amino acids of the polypeptide II. The optimum pH of the enzyme III. The peptide bonds between amino acids of the polypeptide IV. The shape of the substrate molecule

The given graph shows the effect of substrate concentration on the rate of reaction of the enzyme green gram-phosphatase What dose the graph indicate

NTA MOCK TESTS-NTA NEET SET 33-BIOLOGY
  1. Meristems may be classified on the basis of

    Text Solution

    |

  2. some secretary cells synthesize and release glycoproteins. What is the...

    Text Solution

    |

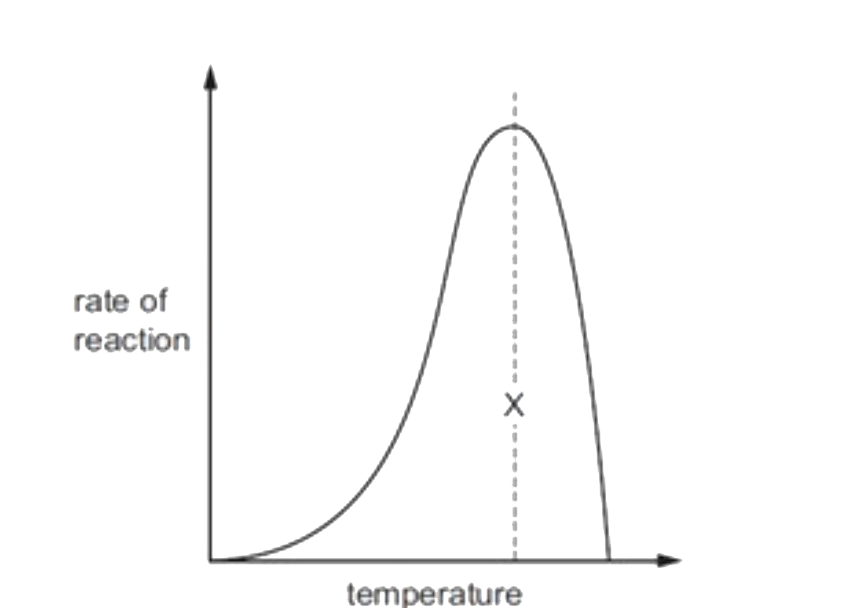
  3. The graph shows the effect of temperature on the rate at which the enz...

    Text Solution

    |

  4. A student comes across the following symbol in a pedigree chart . The ...

    Text Solution

    |

  5. Cattle and goat refrain form feeding on the weed Calotropis because

    Text Solution

    |

  6. A molecule of lactose is formed by a glycosidic bond between

    Text Solution

    |

  7. Secondary carnivores occupy the

    Text Solution

    |

  8. The diagram shows three features found in the tissues of the human res...

    Text Solution

    |

  9. Which of these animals produce gametes by mitosis ?

    Text Solution

    |

  10. Which of these Eltonian pyramids are correctly described ?

    Text Solution

    |

  11. Identify the row having features true for a typical plant cell .

    Text Solution

    |

  12. Which of these genotypes are of homozygous individuals ?

    Text Solution

    |

  13. Evolutionary biology is the study of

    Text Solution

    |

  14. currently we are experiencing the..... episode of mass extinction of s...

    Text Solution

    |

  15. The longest pollen grain is found in the species of angiosperms which ...

    Text Solution

    |

  16. which statement explains why DNA replication is described as semi - co...

    Text Solution

    |

  17. This flowchart is a simplified model of Phosphorous cycle . Identify l...

    Text Solution

    |

  18. Biodiversity hotspots are regions with

    Text Solution

    |

  19. Three Mile Island in Dauphin country , Pennsylvania, USA is known for

    Text Solution

    |

  20. The sequence of bases on part of a molecule of DNA is shown. TACAAAT...

    Text Solution

    |