A
B
C
D
Text Solution
Verified by Experts
The correct Answer is:


Topper's Solved these Questions
Similar Questions
Explore conceptually related problems
NTA MOCK TESTS-NTA NEET SET 61-PHYSICS
- A bullet of mass m leaves a gun of mass M kept on a smooth horizontal ...
Text Solution
|
- A chain of 125 links is 1.25 m long and has mass of 2 kg with the ends...
Text Solution
|
- A ball is dropped from a certain height on a horizontal floor. The coe...
Text Solution
|
- Resistors of 1, 2, 3 ohm are connected in the form of a triangle. If ...
Text Solution
|
- The current in self -inductance L=40 mH is to be be increased uniform...
Text Solution
|
- Charges are placed at the vertices of a square as shown in the diagram...
Text Solution
|
- Two particles of same mass m go around a circle of radius R under the ...
Text Solution
|
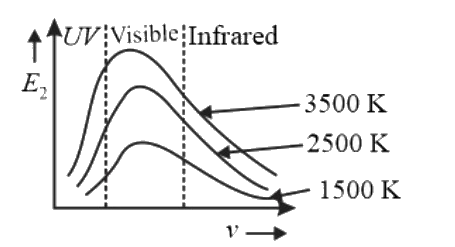
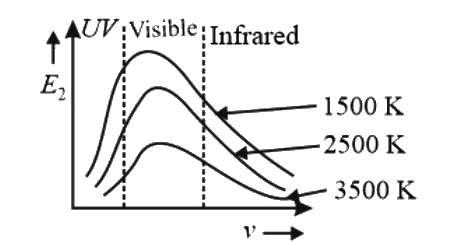
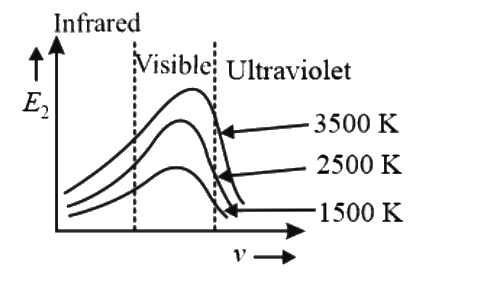
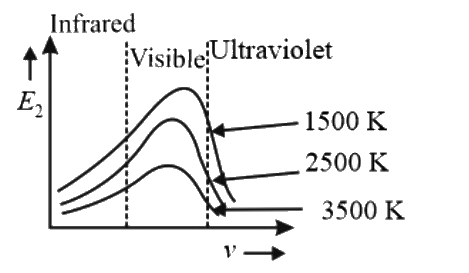
- Following graphs shows the variation in the intensity of heat radiatio...
Text Solution
|
- For a gas R/CV = 0.4, where R is the universal gas constant and C, is ...
Text Solution
|
- Magnetic field at the center (at nucleus) of the hydrogen like atom ("...
Text Solution
|
- Two bodies are projected at angle theta and (90 -theta) to the horizo...
Text Solution
|
- Three identical blocks each of mass M are along a frictionless table a...
Text Solution
|
- Time period of pendulum, on a satellite orbiting the earth, is
Text Solution
|
- Sodium and copper have work functions 2.3 eV and 4.5 eV respectively ....
Text Solution
|
- When one end of the capillary is dipped in water, the height of wa...
Text Solution
|
- An object is placed at a distance of 20 cm from a concave mirror of fo...
Text Solution
|
- A particle of mass m is projected with a velocity v making an angle of...
Text Solution
|
- In the middle of the depletion layer of a reverse - biased p - n junc...
Text Solution
|
- An iron rod is placed parallel to magnetic field of intensity 2000 Am^...
Text Solution
|
- The temperature at which the speed of sound in air becomes double of i...
Text Solution
|