Text Solution
Verified by Experts


Topper's Solved these Questions
STATISTICS AND PROBABILITY
NCERT EXEMPLAR|Exercise VERY SHORT ANSWERS QUESTIONS|2 VideosSTATISTICS AND PROBABILITY
NCERT EXEMPLAR|Exercise LONG ASWERS QUESTIONS|5 VideosREAL NUMBERS
NCERT EXEMPLAR|Exercise Real Numbers|39 VideosSURFACE AREAS AND VOLUMES
NCERT EXEMPLAR|Exercise Surface Areas And Volumes|62 Videos
Similar Questions
Explore conceptually related problems
NCERT EXEMPLAR-STATISTICS AND PROBABILITY-LONG ASWERS QUESTIONS
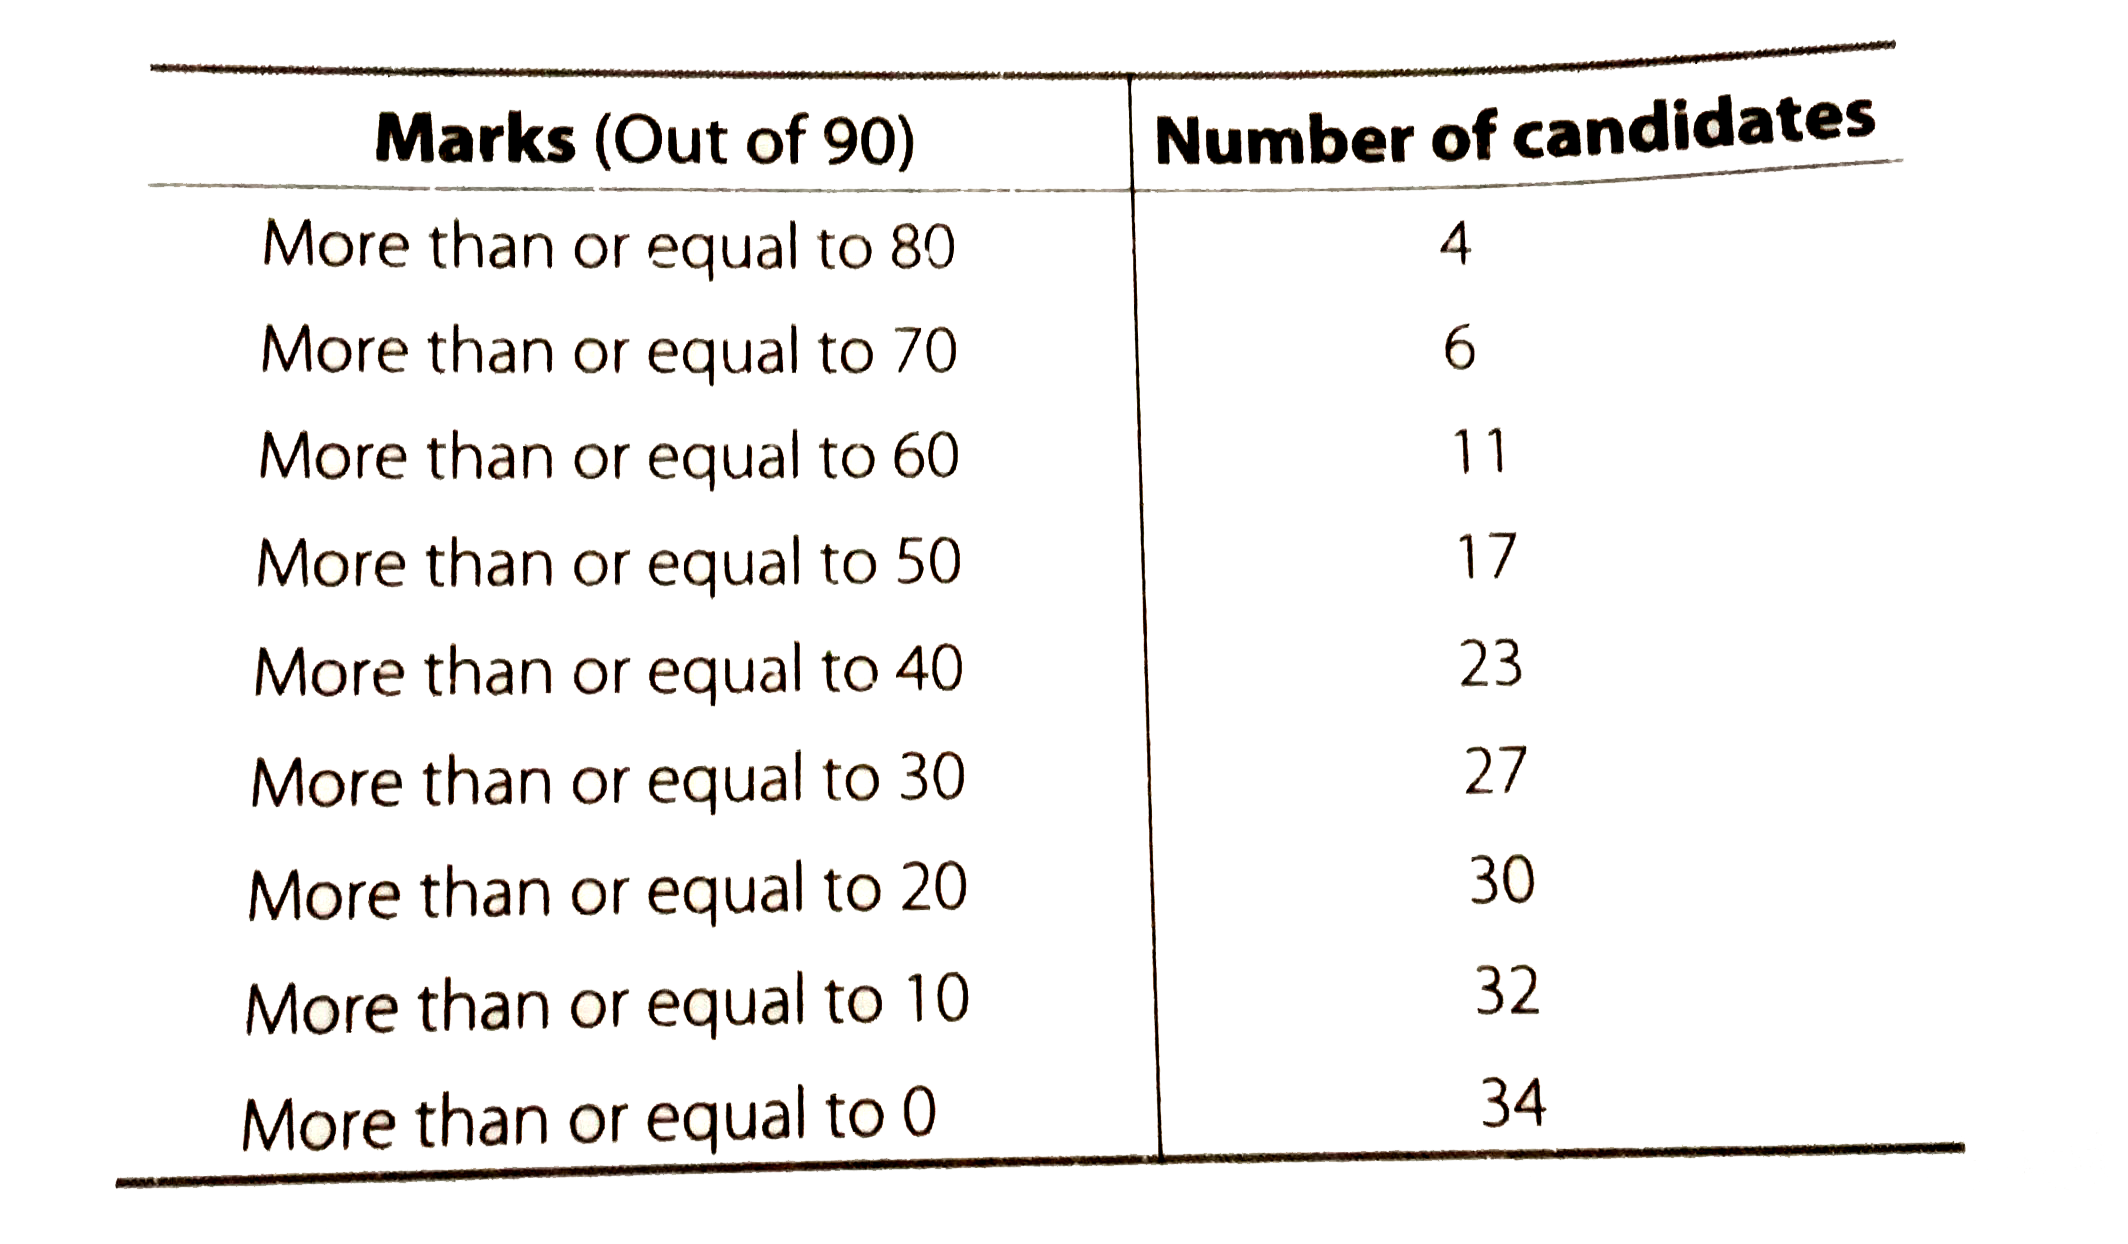
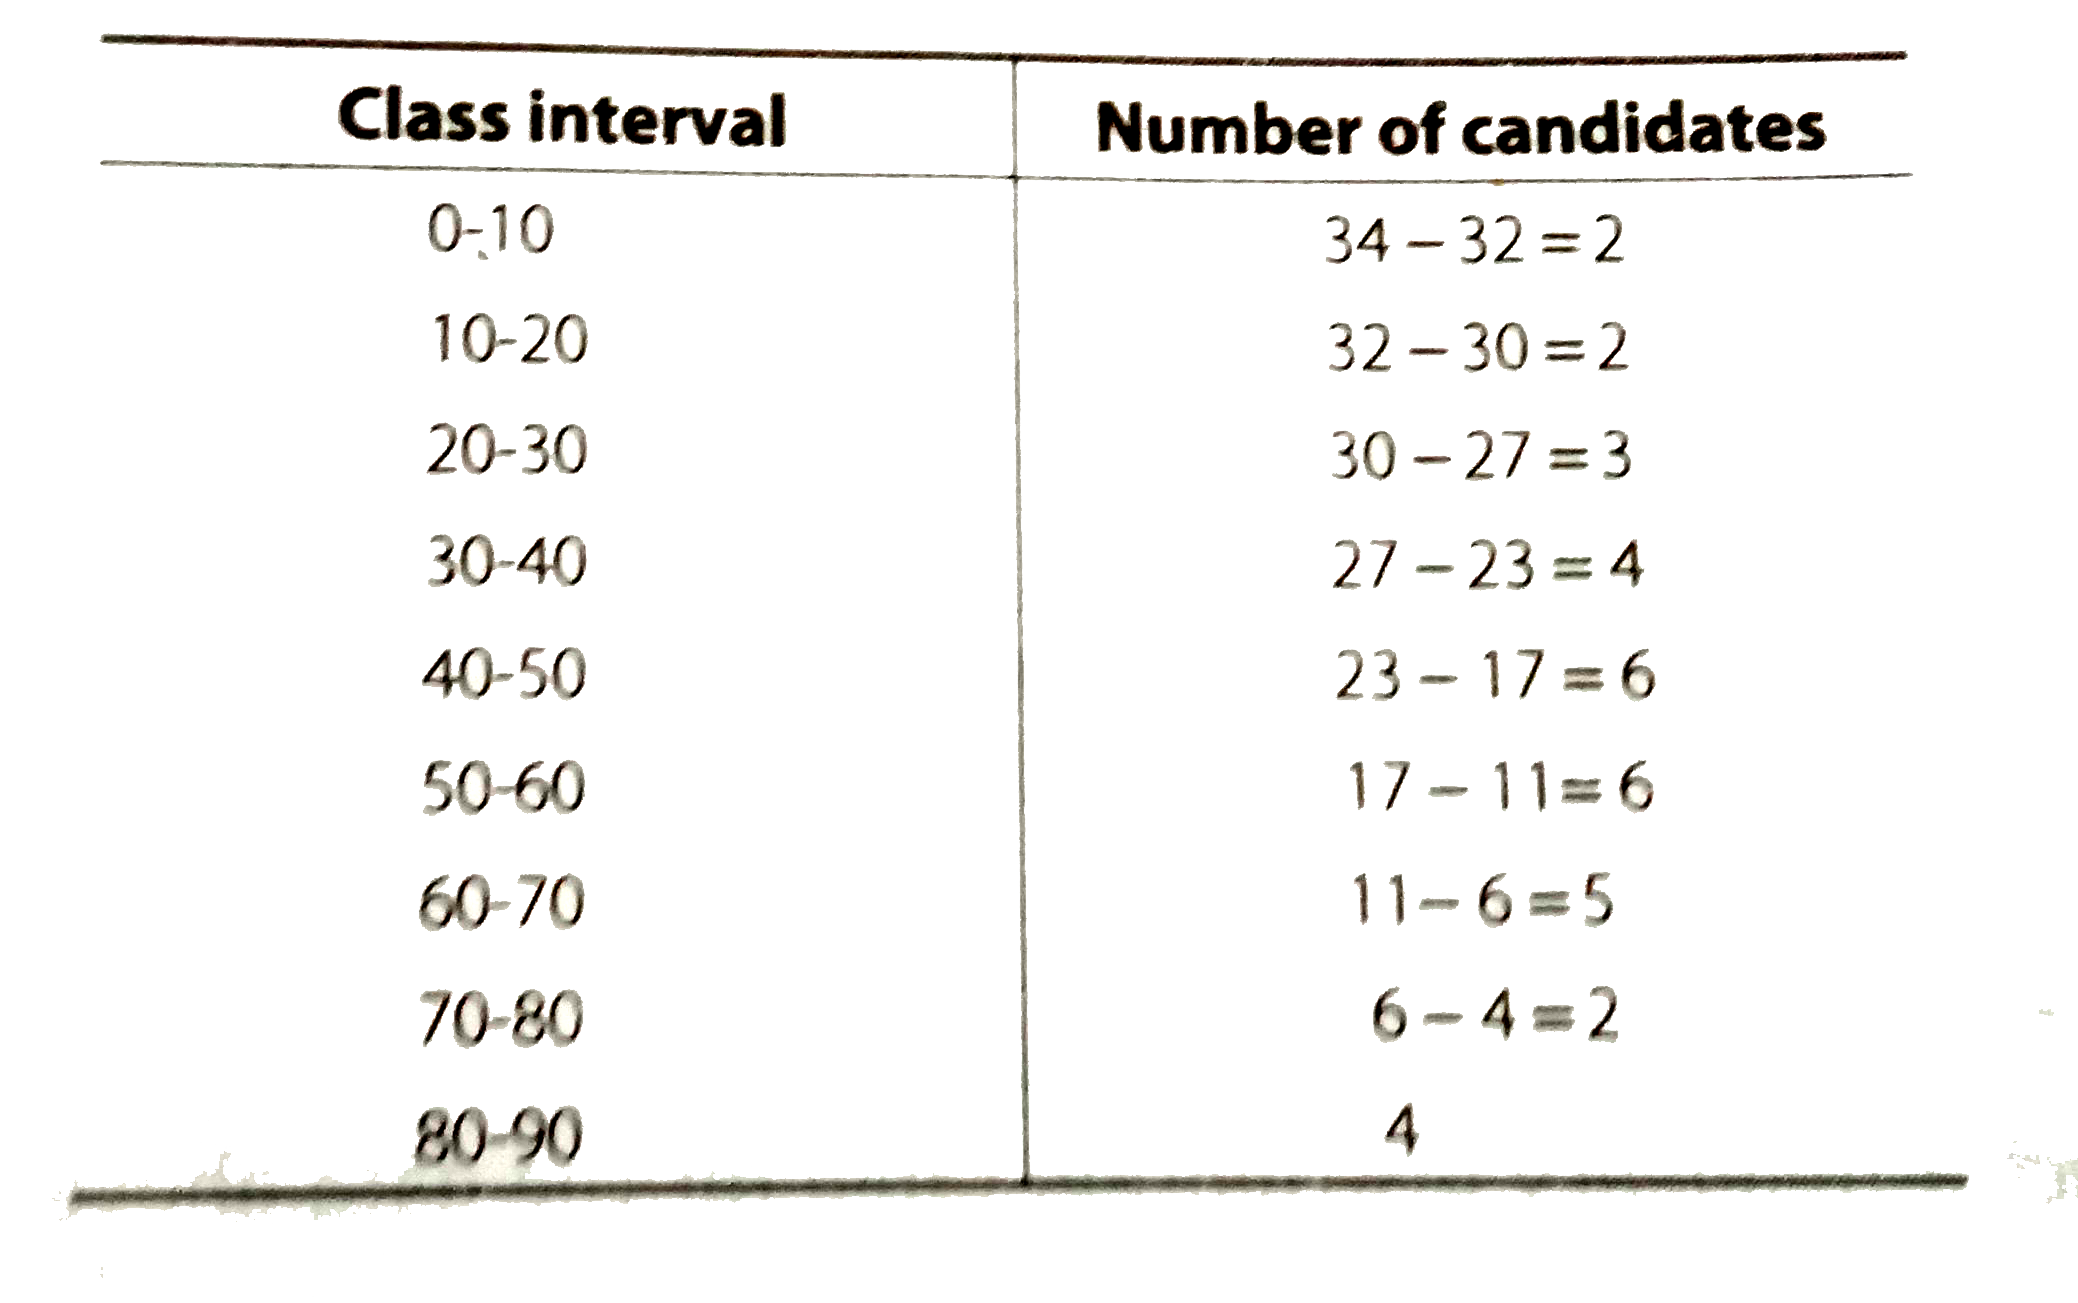
- From the frequency distribution table from the following data
Text Solution
|
- Refer to 0.4 above. Draw the less then type ogive for this data and us...
Text Solution
|
- Refer to 0.5 above. Draw the less then type ogive for this data and us...
Text Solution
|
- The distribution of heights (in cm) of 96 children is given below ...
Text Solution
|
- The annual rainful recored of a city for 66 day is given in the follow...
Text Solution
|
- The following is the frequency distribution of duration for 100 calls ...
Text Solution
|