A
B
C
D
Text Solution
Verified by Experts
The correct Answer is:


Topper's Solved these Questions
KINETIC THEORY
AAKASH INSTITUTE|Exercise EXERCISE (ASSIGNMENT) SECTION - A Objective Type Questions|30 VideosKINETIC THEORY
AAKASH INSTITUTE|Exercise EXERCISE (ASSIGNMENT) SECTION - B Objective Type Questions|30 VideosKINETIC THEORY
AAKASH INSTITUTE|Exercise EXERCISE (TRY YOURSELF)|40 VideosGRAVITATION
AAKASH INSTITUTE|Exercise ASSIGNMENT SECTION - D (ASSERTION-REASON TYPE QUESTIONS)|16 VideosLAWS OF MOTION
AAKASH INSTITUTE|Exercise Assignment (SECTION-D) (Assertion-Reason Type Questions)|15 Videos
Similar Questions
Explore conceptually related problems
AAKASH INSTITUTE-KINETIC THEORY-EXERCISE
- Each molecule of a gas has F degrees of freedom . The ratio (C(p))/(C(...
Text Solution
|
- At constant pressure the r.m.s. velocity c is related to density d as
Text Solution
|
- The mean rotational kinetic energy of a diatomic molecule at temperatu...
Text Solution
|
- A jar has a mixture of hydrogen and oxygen gas in the ratio of 1 : 5. ...
Text Solution
|
- The root mean square speed of the molecules of an enclosed gas is 'v'....
Text Solution
|
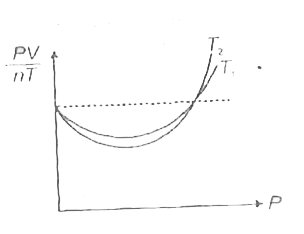
- The figure shows the plot of (PV)/(nT) vs P, for oxygen gas at two dif...
Text Solution
|
- The temperature of an ideal gas is increased from 27 ^@ C to 927^(@)C....
Text Solution
|
- Which of the following has possesses maximum rms velocity? All being a...
Text Solution
|
- A container is filled with a simple of gas having molecules with speed...
Text Solution
|
- A vessel contains a non-linear triatomic. If 50% of gas dissociate int...
Text Solution
|