A
B

C

D

Text Solution
Verified by Experts
The correct Answer is:


Topper's Solved these Questions
ALTERNATING CURRENT
NCERT FINGERTIPS|Exercise Ac Voltage Applied To A Series Lcr Circuit|28 VideosALTERNATING CURRENT
NCERT FINGERTIPS|Exercise Power In Ac Circuit|13 VideosALTERNATING CURRENT
NCERT FINGERTIPS|Exercise Ac Voltage Applied To A Inductor|5 VideosATOMS
NCERT FINGERTIPS|Exercise Assertion And Reason|15 Videos
Similar Questions
Explore conceptually related problems
NCERT FINGERTIPS-ALTERNATING CURRENT -Ac Voltage Applied To A Capacitor
- In a pure capacitive circuit if the frequency of ac source is doubled,...
Text Solution
|
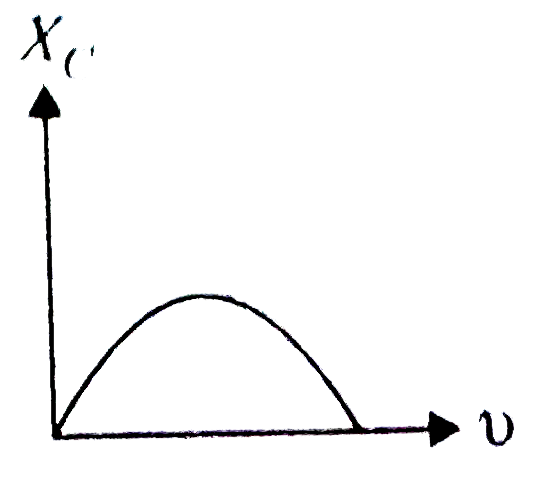
- Identify the graph which correctly reperesents the variation of capaci...
Text Solution
|
- A 5mu F capacitor is connected to a 200 V, 100 Hz ac source. The capac...
Text Solution
|
- If a capacitor of 8 mu F is connected to a 220 V, 100 Hz ac source and...
Text Solution
|
- Phase difference between voltage and current in a capacitor in an ac c...
Text Solution
|
- In an alternating current circuit consisting of elements in series, th...
Text Solution
|
- A 30 mu F capacitor is connected to a 150 V, 60 Hz ac supply. The rms ...
Text Solution
|
- A 60 mu F capacitor is connected to a 110 V, 60 Hz a.c. supply Determi...
Text Solution
|
- In the question number 30, the net power absorbed by the circuit in on...
Text Solution
|
- In which of following circuits the maximum power dissipation is observ...
Text Solution
|
- When an AC voltage of 220 V is applied to the capacitor C
Text Solution
|
- An alternating voltage (in volts) given by V=200sqrt(2)sin(100t) is co...
Text Solution
|