A
B
C
D
Text Solution
Verified by Experts
The correct Answer is:


Topper's Solved these Questions
Similar Questions
Explore conceptually related problems
DINESH PUBLICATION-SOLUTIONS -ULTIMATE PREPARATORY PACKAGE
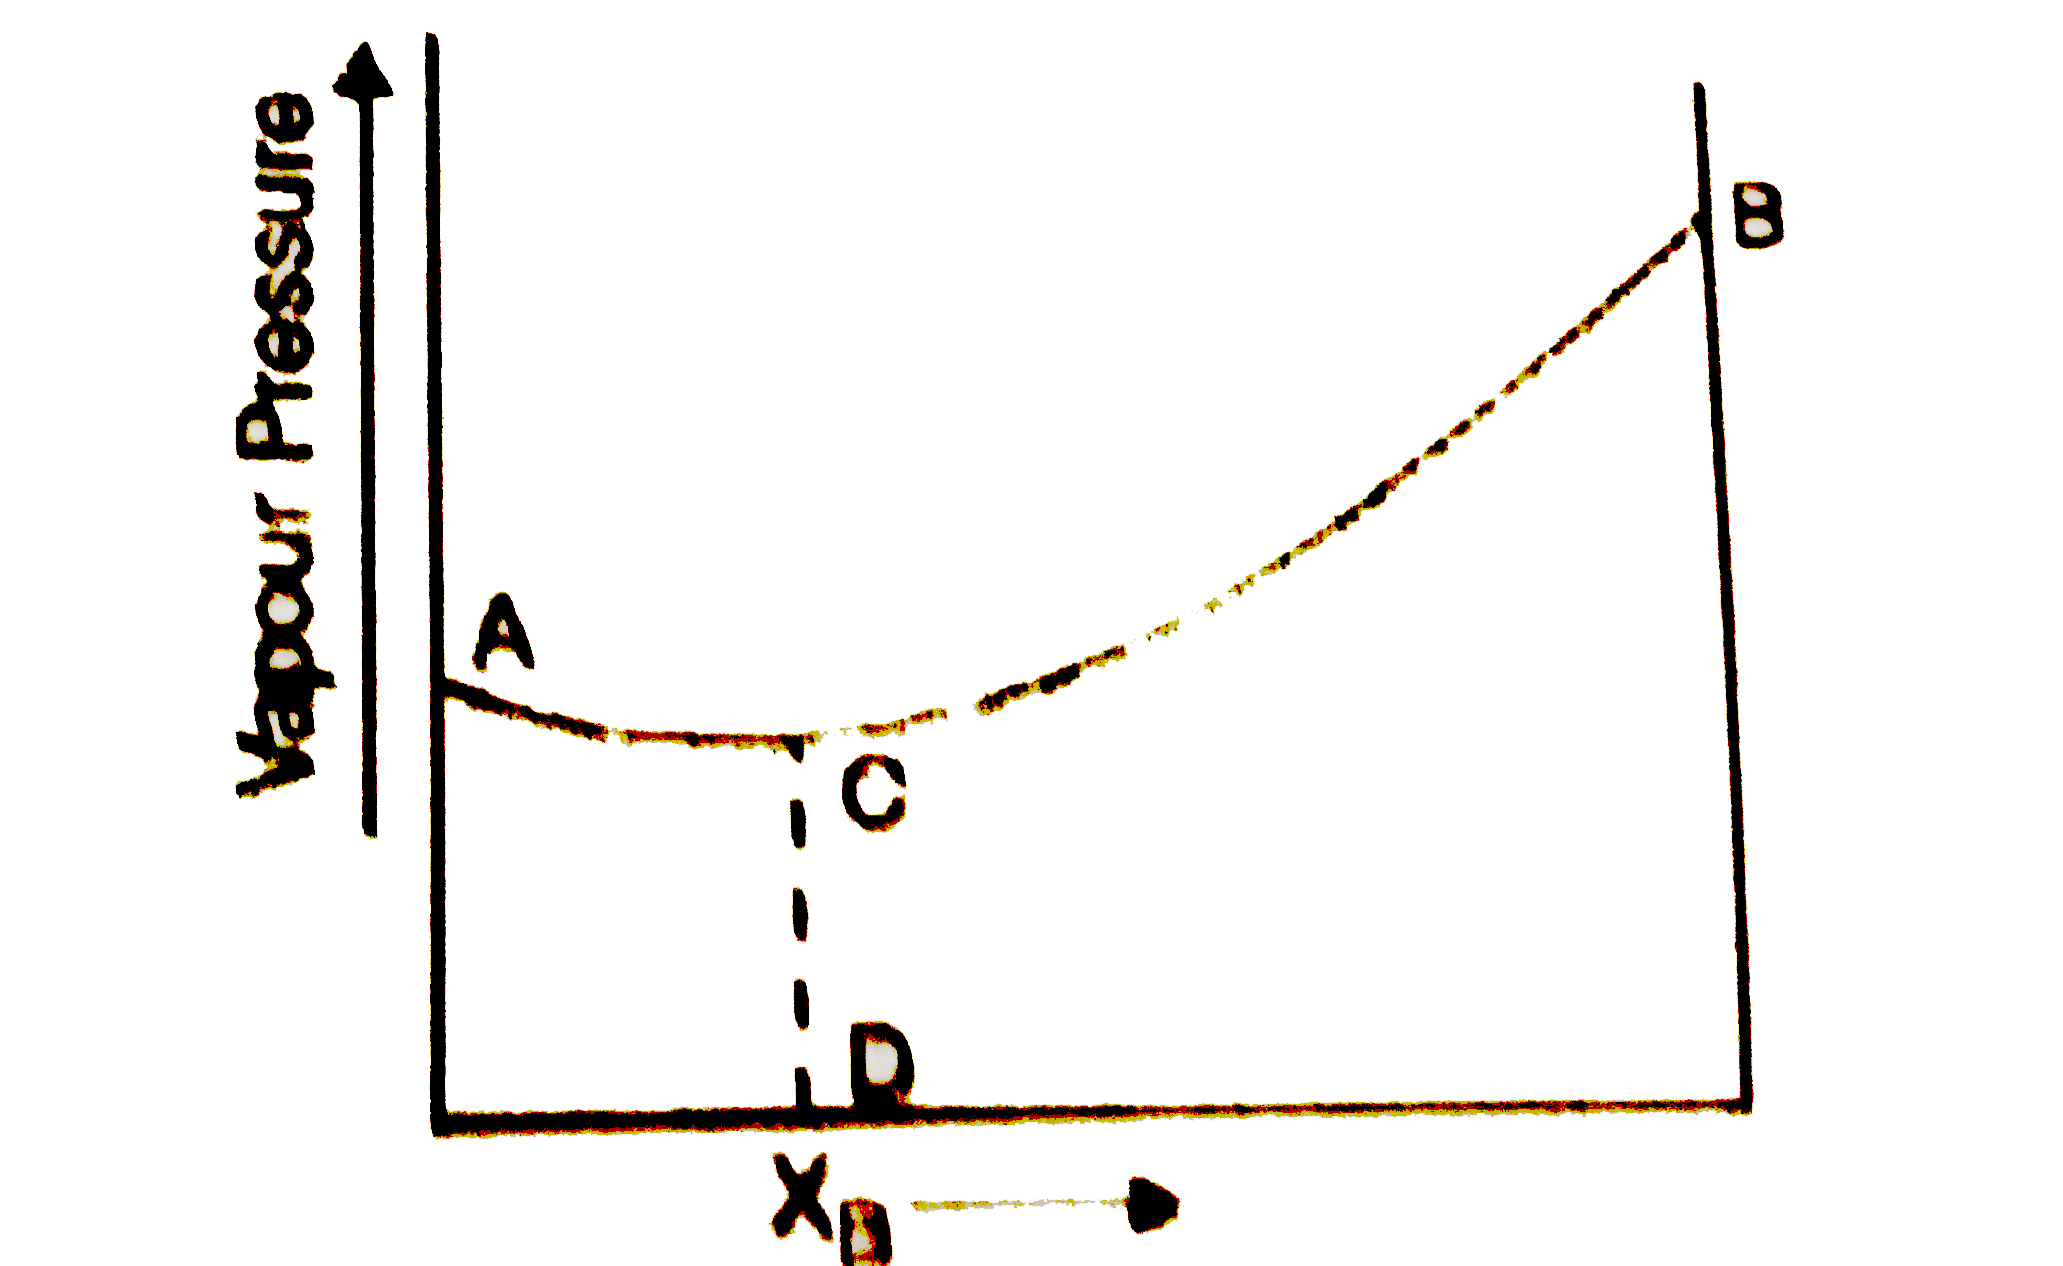
- The diagram given below is a vapour pressure composition diagram for a...
Text Solution
|
- The temperature at which molarity of pure water is equal to its molali...
Text Solution
|
- Some pure ice is put in brine taken in a perfect insulated container a...
Text Solution
|
- For the dissolution of an ionic solid in water
Text Solution
|
- A 1m solution can be more concentrated than a 1M solution if
Text Solution
|
- A substance is hygroscopic at a constant temperature if vapour pressur...
Text Solution
|
- A substance is efflorescent at a particular level if its vapour pressu...
Text Solution
|
- The beakers A and B containing pure water (A) and an aqueous solution ...
Text Solution
|
- A Beckmann thermometer is used to measure
Text Solution
|
- Some common salt is added to ice taken in a flask kept at 0^(@)C. Wit...
Text Solution
|
- Calculate the freezing point of an aqueous soltuion of non-electrolyte...
Text Solution
|