A
B
C
D
Text Solution
Verified by Experts
The correct Answer is:


Topper's Solved these Questions
Similar Questions
Explore conceptually related problems
CBSE COMPLEMENTARY MATERIAL-PRACTICE TEST-II-Section C
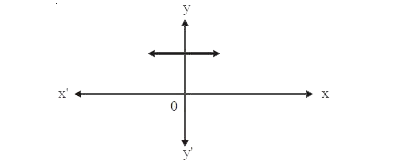
- The graph of y = p(x) is given in the figure. The number of zeros of p...
Text Solution
|
- Evaluate : (cos^(2) 20° + cos^(2) 70°) + (cot 25^(@))/( tan 65^(@)) + ...
Text Solution
|
- BL and CM are medians of a triangle ABC right angled at A. Prove that...
Text Solution
|
- If α and β are zeroes of the polynomial P(x) = 2x^(2) + 11x + 5, find...
Text Solution
|
- Prove that: (sin theta)/(1 - cos theta) + (tan theta)/(1 + cos theta) ...
Text Solution
|
- 1/(x+4)-1/(x-7)=11/30 , x!=-4, 7
Text Solution
|
- Show that one and only one out of n,( n+2) and ( n +4) is divisble by ...
Text Solution
|
- The sum of first six terms of an A.P. is 42. The ratio of its 10th ter...
Text Solution
|
- In the given figure AB is a chord of a circle, with centre O, such tha...
Text Solution
|
- Places A and B are 100 km apart on a highway. One car starts from A an...
Text Solution
|
- Determine the ratio in which the line 3x+y-9=0 divides the segment ...
Text Solution
|
- The angle of elevation of the top of a building from the foot of the t...
Text Solution
|
- Due to sudden floods, some welfare associations jointly requested the ...
Text Solution
|
- The following distribution gives the daily income of 50 workers of a f...
Text Solution
|
- Draw a circle of radius 5 cm. From a point P, 8 cm away from its centr...
Text Solution
|