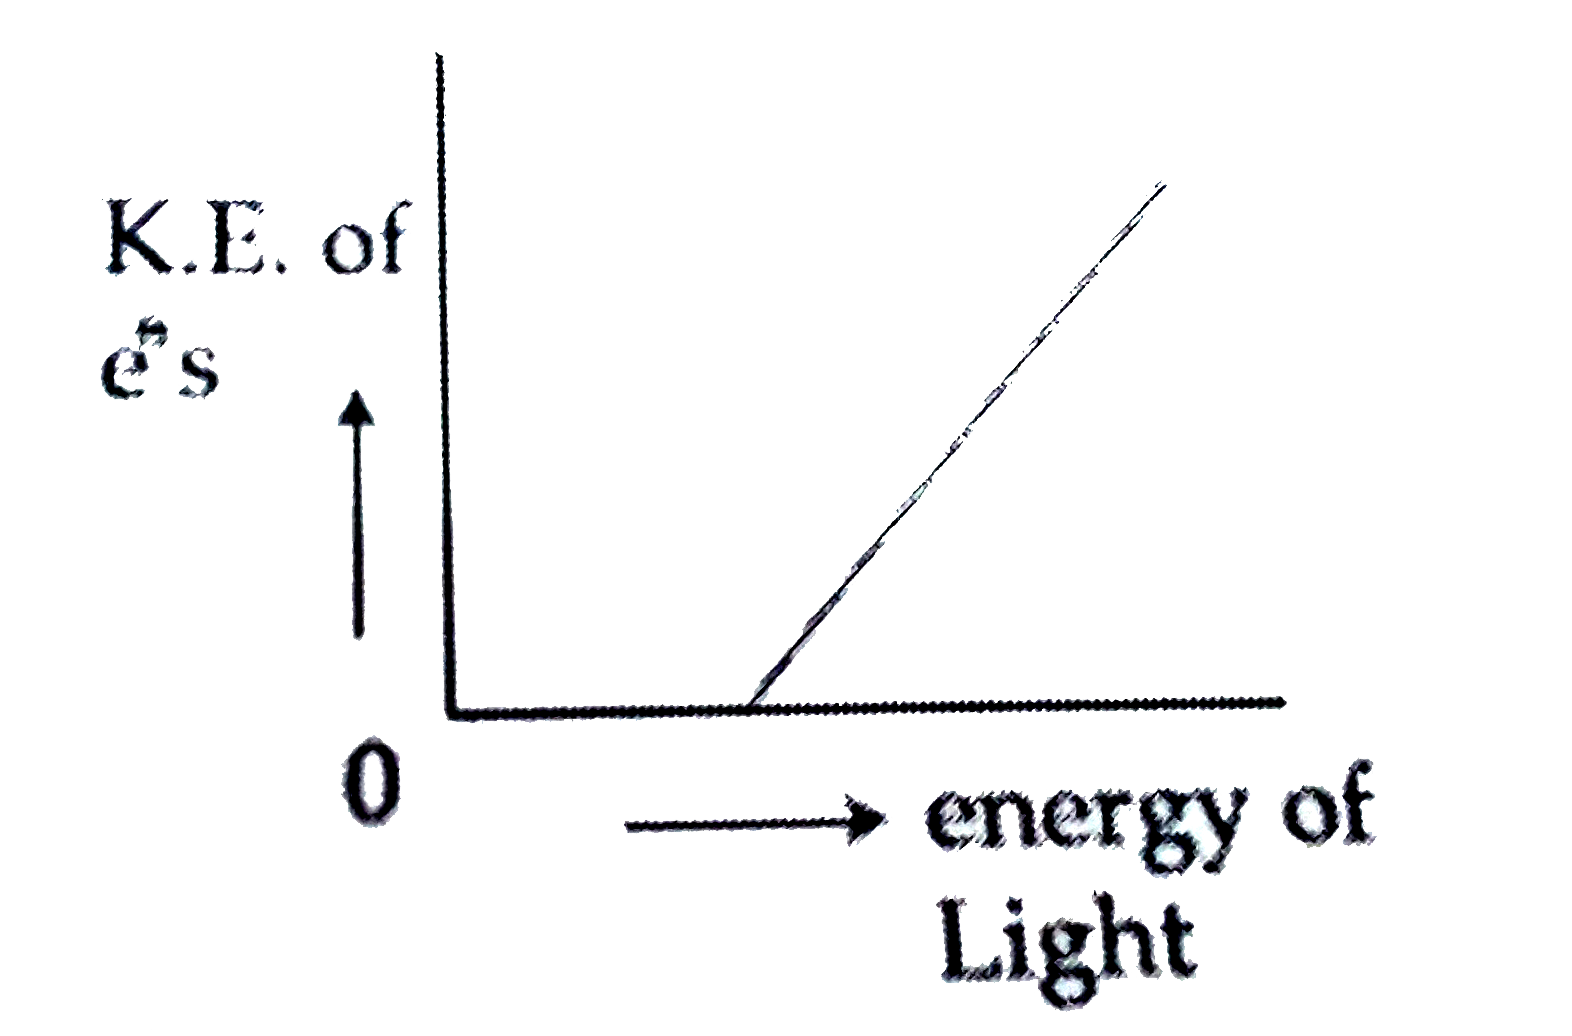
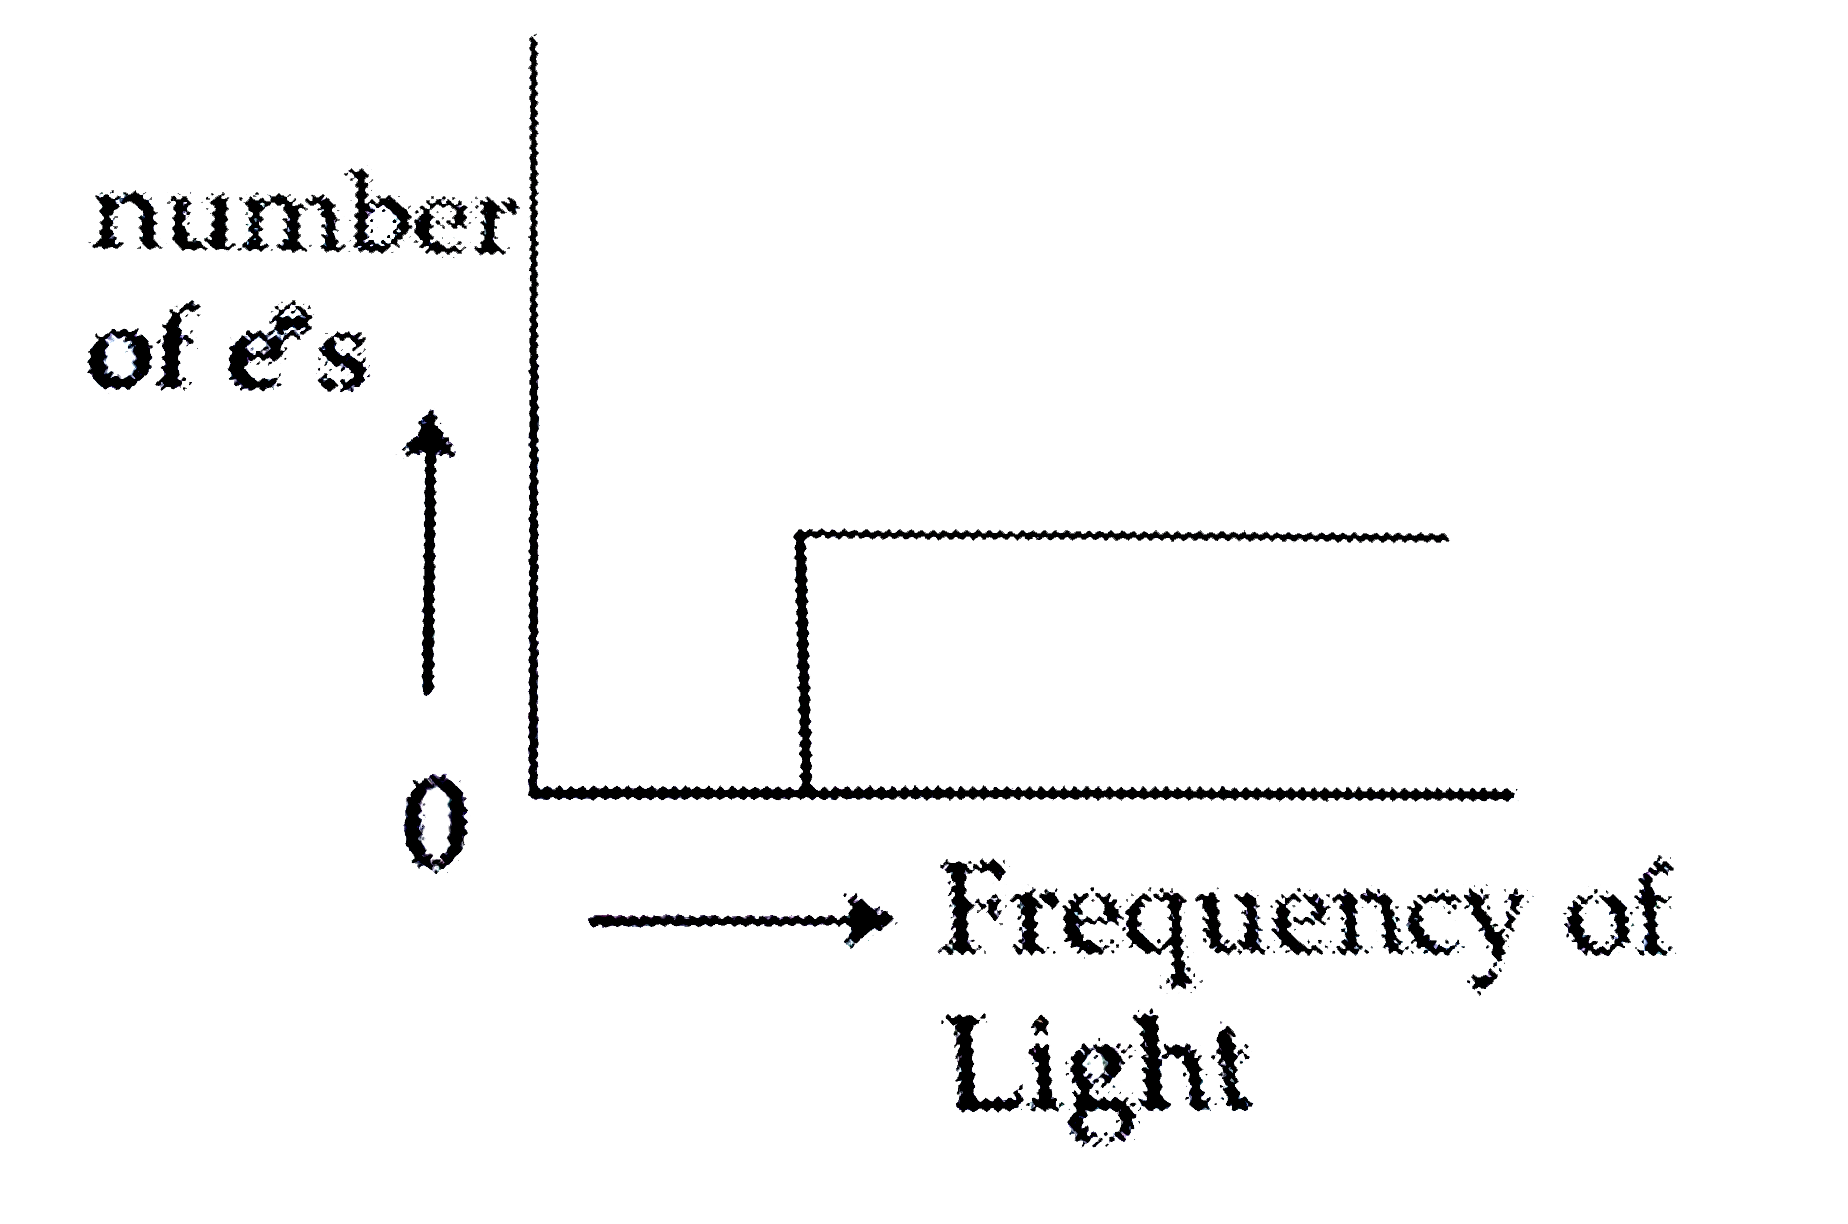
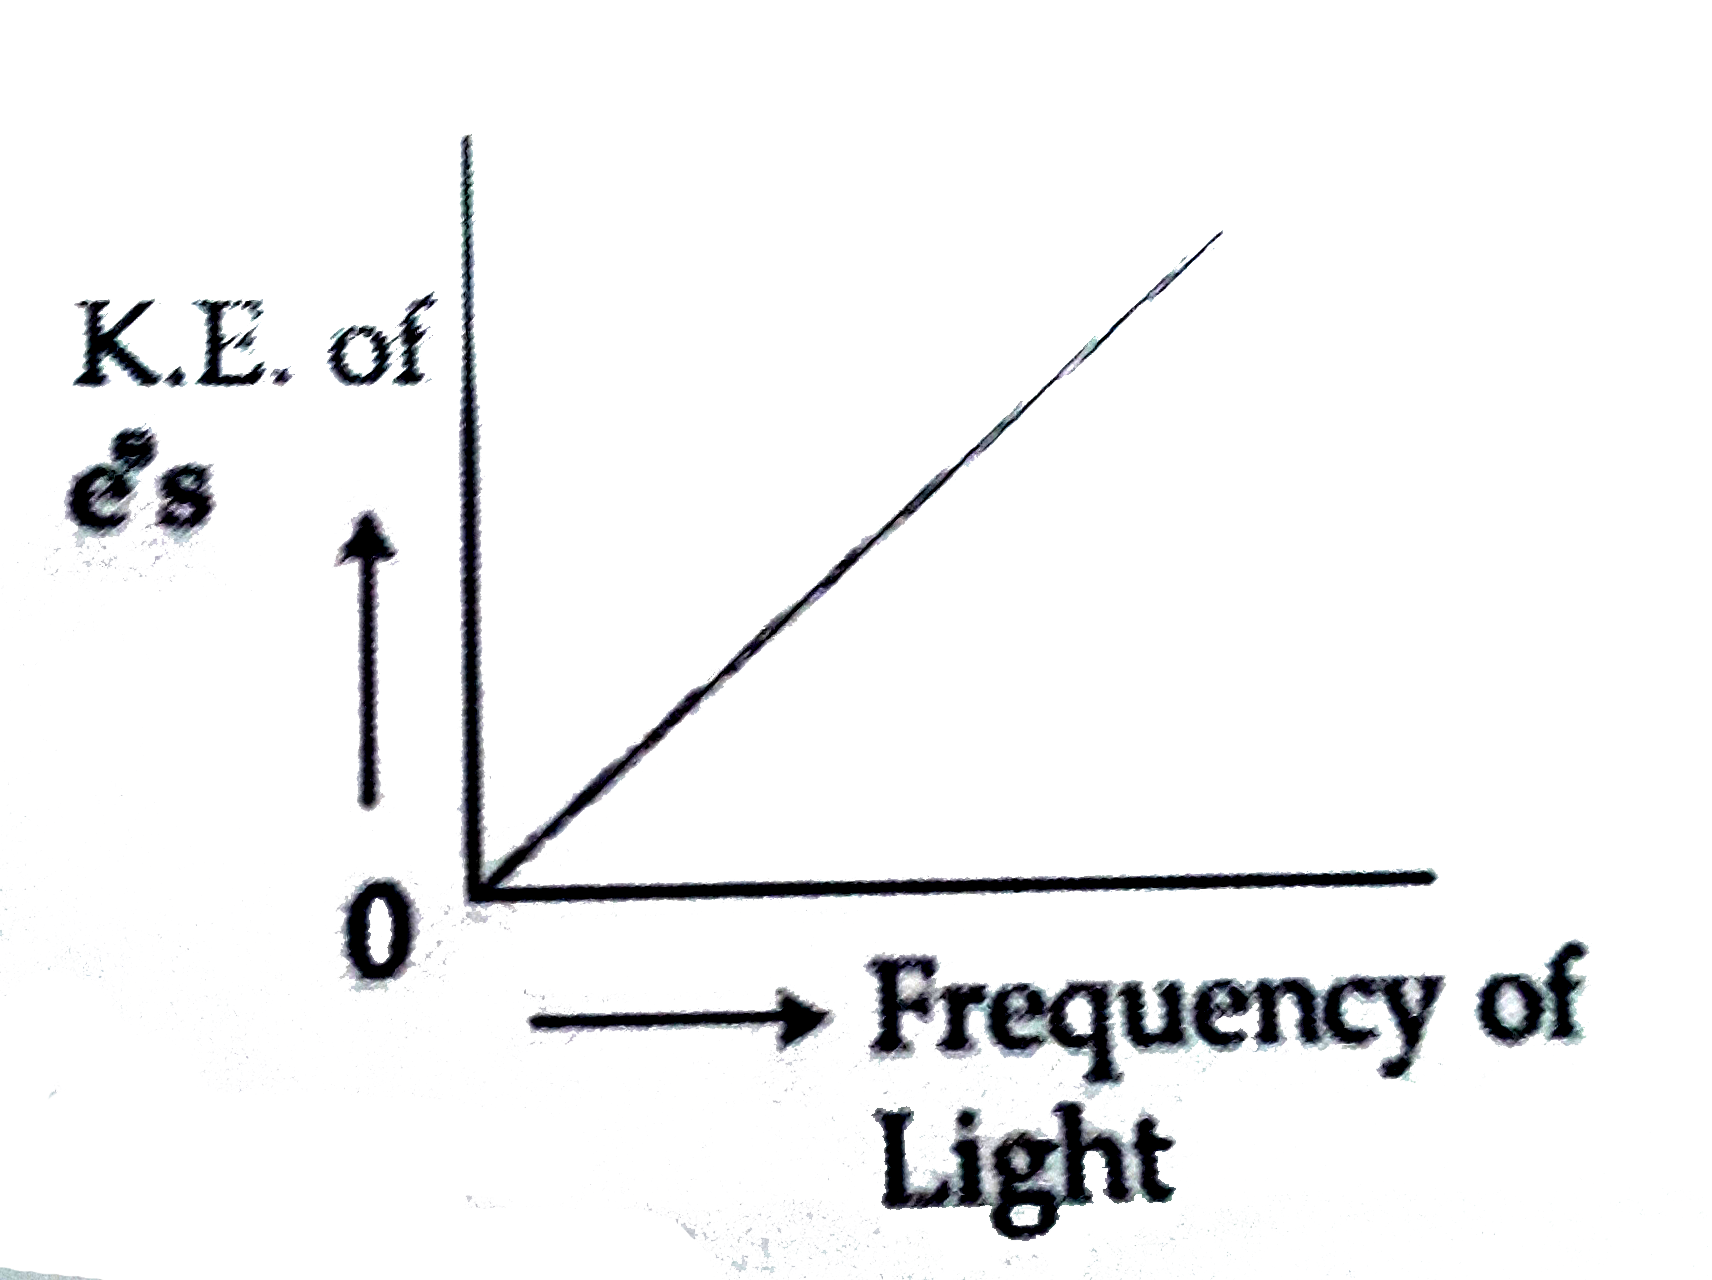
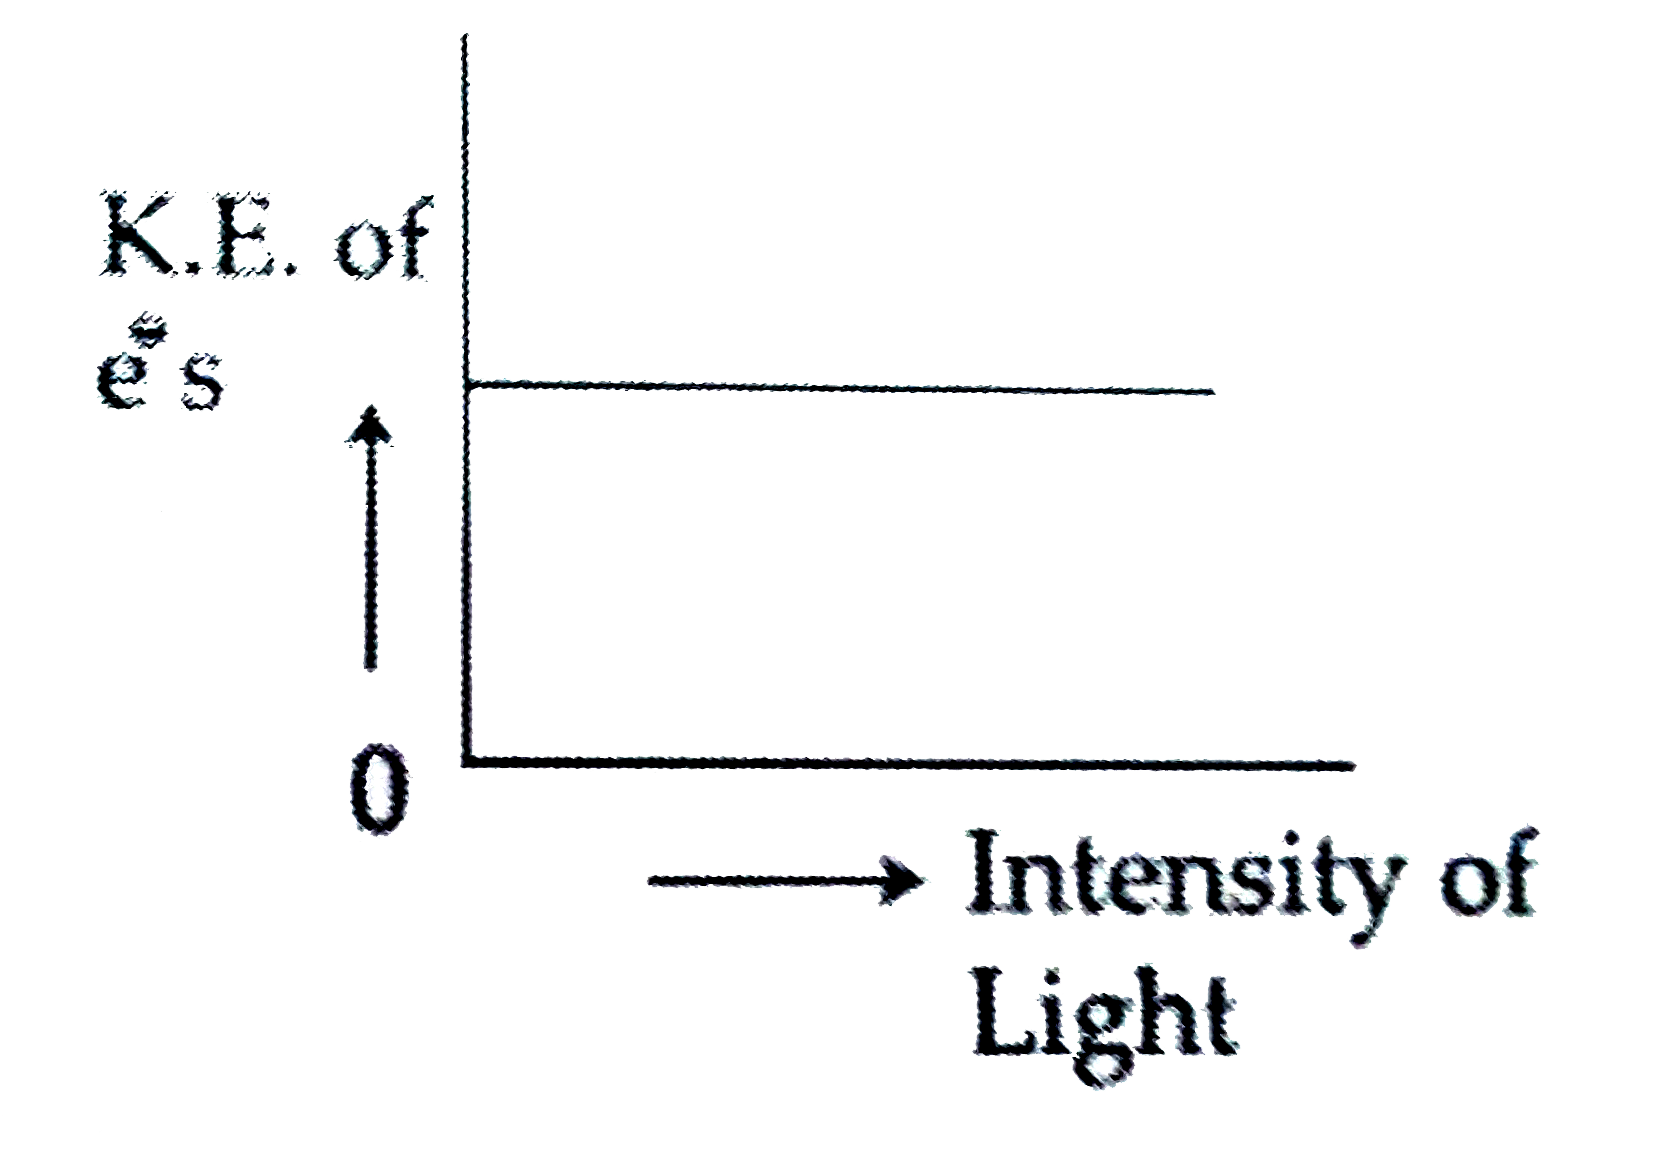
Which of the graphs shown below do not represent the relationship between incident light and the electron ejected from metal surface?
Relationship between incident light and CO_2 fixation rate is
Which of the graphs shown in the figure below best represents the relationship between the radioactive decay rare [-(dN//dt)] and population N?
Is there a time lag between the incident radiation and the emission of electrons from a metal?
Linear relationship exists between incident light and rate of CO_(2) fixation at/in.
If lamda_o and lamda be the threshold wavelength and wavelength of incident light , the velocity of photoelectron ejected from the metal surface is :
By increasing the intensity of incident light on the surface of a metal
Which graph represents the correct relationship between various velocities for an idela gas ?
Assertion : The number of electrons ejected from a metal surface depend upon the frequency of light. Reason : There is a time lag between the striking of light beam and the ejection of electrons from the metal surface.