Text Solution
Verified by Experts


Topper's Solved these Questions
Similar Questions
Explore conceptually related problems
NCERT-STATISTICS-EXERCISE 14.2
- The following data gives the information on the observed lifetimes (i...
Text Solution
|
- The following data gives the distribution of total monthly household ...
Text Solution
|
- The following table shows the ages of the patients admitted in a hosp...
Text Solution
|
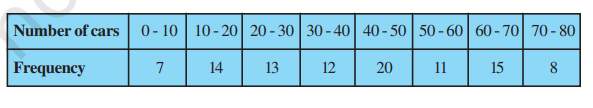
- A student noted the number of cars passing through a spot on a road f...
Text Solution
|
- The following distribution gives the state-wise teacher-student ratio...
Text Solution
|
- The given distribution shows the number of runs scored by some top ba...
Text Solution
|