A
B
C
D
Text Solution
Verified by Experts
The correct Answer is:


Topper's Solved these Questions
CHEMICAL KINETICS
CBSE COMPLEMENTARY MATERIAL|Exercise VERY SHORT ANSWER TYPE QUESTIONS|24 VideosCHEMICAL KINETICS
CBSE COMPLEMENTARY MATERIAL|Exercise SHORT ANSWER-I TYPE QUESTIONS|26 VideosBIOMOLECULES
CBSE COMPLEMENTARY MATERIAL|Exercise SHORT ANSWER-II TYPE QUESTION|13 VideosCHEMISTRY IN EVERYDAY LIFE
CBSE COMPLEMENTARY MATERIAL|Exercise LONG ANSWER TYPE QUESTIONS|2 Videos
Similar Questions
Explore conceptually related problems
CBSE COMPLEMENTARY MATERIAL-CHEMICAL KINETICS-LONG ANSWER TYPE QUESTIONS
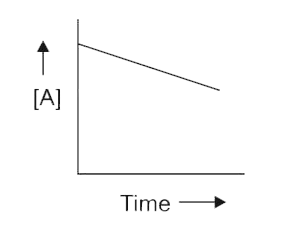
- The following graph show that the reaction is:
Text Solution
|
- Define 'order of a reaction'.
Text Solution
|
- Rates of reaction double with every 10^@ rise in temperature. If this ...
Text Solution
|
- What are pseudo order reaction ? Give example.
Text Solution
|
- The rate constant 'k'. For a reaction varies with temperature 'T' acco...
Text Solution
|
- Determine the units of rate constant for first and zero order reaction...
Text Solution
|
- Show that time required for the completion of 99% of the first order ...
Text Solution
|
- Define rate constant of reaction.
Text Solution
|
- A first order reaction takes 40 min for 30% decomposition. Calculate t...
Text Solution
|
- Determine the order of reaction and also determine the units of rate ...
Text Solution
|
- The following data were given for thermal decomposition of SO2Cl2 at ...
Text Solution
|
- The energy of activation for a reaction is 100 KJ mol^(-1). The perese...
Text Solution
|
- A + 2Bto 3C + 2D The rate of disappearance of B is 1xx 10^(–2) "mo...
Text Solution
|