Text Solution
Verified by Experts


Topper's Solved these Questions
MOTION
CPC CAMBRIDGE PUBLICATION|Exercise Additional Question ( Answer the Question )|11 VideosMOTION
CPC CAMBRIDGE PUBLICATION|Exercise Unit Test|6 VideosMOTION
CPC CAMBRIDGE PUBLICATION|Exercise Unit Test|6 VideosGRAVITATION
CPC CAMBRIDGE PUBLICATION|Exercise ADDITIONAL QUESTIONS (MATCH THE FOLLOWING)|1 VideosSOUND
CPC CAMBRIDGE PUBLICATION|Exercise ADDITIONAL QUESTIONS (IV. Answer the following :-)|10 Videos
CPC CAMBRIDGE PUBLICATION-MOTION-Exercise
- An athlete completes one round of a circular track of diameter 200 m i...
Text Solution
|
- Joseph jogs from end A to the other B of a straight 300m road in 2min ...
Text Solution
|
- Abdul, while driving to school, computes the average speed for his tri...
Text Solution
|
- A motorboat starting from rest on a lake accelerates in a straight lin...
Text Solution
|
- A driver of a car travelling at 52 km h^(-1) applies the brakes and ac...
Text Solution
|
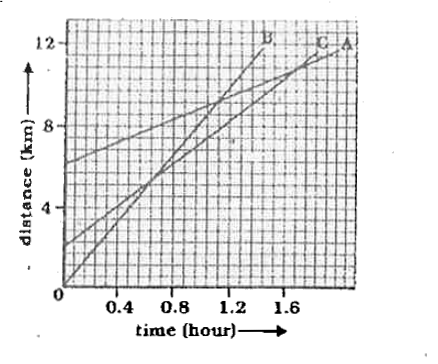
- Fig. shows the distance-time graph of three objects A, B and C. Study ...
Text Solution
|
- Fig. shows the distance-time graph of three objects A, B and C. Study ...
Text Solution
|
- Fig. shows the distance-time graph of three objects A, B and C. Study ...
Text Solution
|
- Figure shows the distance time graph fo three objects A,B and C. Study...
Text Solution
|
- A ball is gently dropped from height of 20m. If its velocity increases...
Text Solution
|
- The speed time graph for a car is shown in fig 8.12 Find out how ...
Text Solution
|
- The speed time graph for a car is shown in fig 8.12 Which part of...
Text Solution
|
- State which of the following situation are possible and give an exampl...
Text Solution
|
- State which of the following situation are possible and give an exampl...
Text Solution
|
- An artificial satellite is moving in a circular orbit of radius 42250K...
Text Solution
|