A
B
C
D
Text Solution
Verified by Experts
The correct Answer is:


Topper's Solved these Questions
LAW OF MOTION
NARAYNA|Exercise EXERCISE - II (H.W)(OBJECTS SUSPENDED BY STRINGS AND APPARENT WEIGHT)|16 VideosLAW OF MOTION
NARAYNA|Exercise EXERCISE - II (H.W)(MOTION ON A HORIZONTAL ROUGH SURFACE)|12 VideosLAW OF MOTION
NARAYNA|Exercise EXERCISE - II (C.W)(CIRCULAR MOTION)|6 VideosKINETIC THEORY OF GASES
NARAYNA|Exercise LEVEL-III(C.W)|52 VideosMATHEMATICAL REVIEW & PHYSICAL WORLD
NARAYNA|Exercise C.U.Q|13 Videos
Similar Questions
Explore conceptually related problems
NARAYNA-LAW OF MOTION-EXERCISE - II (H.W)(NEWTON.S LAWS OF MOTION)
- A ball of mass 0.2 kg is thrown vertically upwards by applying a force...
Text Solution
|
- A body of mass 3 kg is moving along a straight line with a velocity of...
Text Solution
|
- A ball of mass 10 gm dropped from a height of 5m hits the floor and re...
Text Solution
|
- A stream of water flowing horizontally with a speed of 15 ms^(-1) push...
Text Solution
|
- What is the magnitude of the total force on a driver by the racing car...
Text Solution
|
- A base ball of mass 150 gm travelling at speed of 20 m//s is caught by...
Text Solution
|
- A dynamometer D, which is a device used to measure force, is attached ...
Text Solution
|
- A particle of mass m moving with velocity u makes an elastic one-dimen...
Text Solution
|
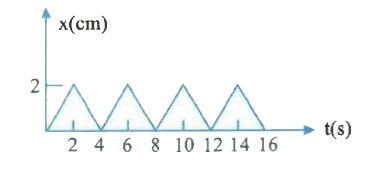
- The position-time graph of a body of mass 0.04kg is shown in the figur...
Text Solution
|