A
B
C
D
Text Solution
Verified by Experts
The correct Answer is:


Topper's Solved these Questions
STATES OF MATTER
NARAYNA|Exercise A & R TYPE QUESTIONS|16 VideosSTATES OF MATTER
NARAYNA|Exercise EXERCISE - 3|32 VideosSOME BASIC PRINCIPLES AND TECHNIQUES
NARAYNA|Exercise EXERCISE -IV (QUALITATIVE AND QUANTITATIVE ANALYSIS OF ORGANIC OF COMPOUNDS)|8 VideosSTRUCTURE OF ATOM
NARAYNA|Exercise EXERCISE - IV EXEMPLAR PROBLEMS|24 Videos
Similar Questions
Explore conceptually related problems
NARAYNA-STATES OF MATTER-EXERCISE - 4 (EXAMPLAR PROBLEMS)
- the pressure of a 1 : 4 mixture of dihydrogen and dioxygen enclosed in...
Text Solution
|
- As the temperature increases, average kinetic energy of molecules incr...
Text Solution
|
- Gases posses characteristic critical temperature which depends upon th...
Text Solution
|
- What is SI unit of viscosity coefficient (eta) ?
Text Solution
|
- Atmospheric pressure recorded in different citie are as follows {:("...
Text Solution
|
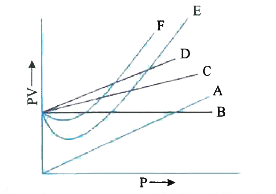
- Which curve in the following graph represents the curve of ideal gas ?
Text Solution
|
- Increase in kinetic energy can overcome intermolecular forces of attra...
Text Solution
|
- How does the surface tension of a liquid vary with increase in tempera...
Text Solution
|
- With regard to the gaseous state of matter which of the following stat...
Text Solution
|
- Which of the following figures does not represent 1 mole of dioxygen g...
Text Solution
|
- Under which of the following conditions applied together, a gas deviat...
Text Solution
|
- Which of the following changes decrease the vapour pressure of water k...
Text Solution
|
- If 1 g of each of the following gases are takes at STP, which of the g...
Text Solution
|
- The molar volume of dinitrogen at 273.15 K and 1 atm pressure is 22.4 ...
Text Solution
|
- The correct decreasing order of surface tension for water , ethanol an...
Text Solution
|
- Critical temperature (T(C)) and critical pressure (P(C)) of carbon dio...
Text Solution
|
- The correct increasing order of Vanderwaal constant 'b' for H(2) , O(2...
Text Solution
|
- The correct decreasing order of Vanderwaal constant 'a' for H(2) , CH(...
Text Solution
|
- The viscosity order of water , n - hexane and glycerol is
Text Solution
|
- At certain temperature the volume - pressure curves for four gases A ,...
Text Solution
|