Home
Class 6
MATHS
The performance of 720 students in an ex...

The performance of 720 students in an examination for the academic year 2015-16 is shown in a pie chart. Study the pie chart carefully and answer the questions that follow.

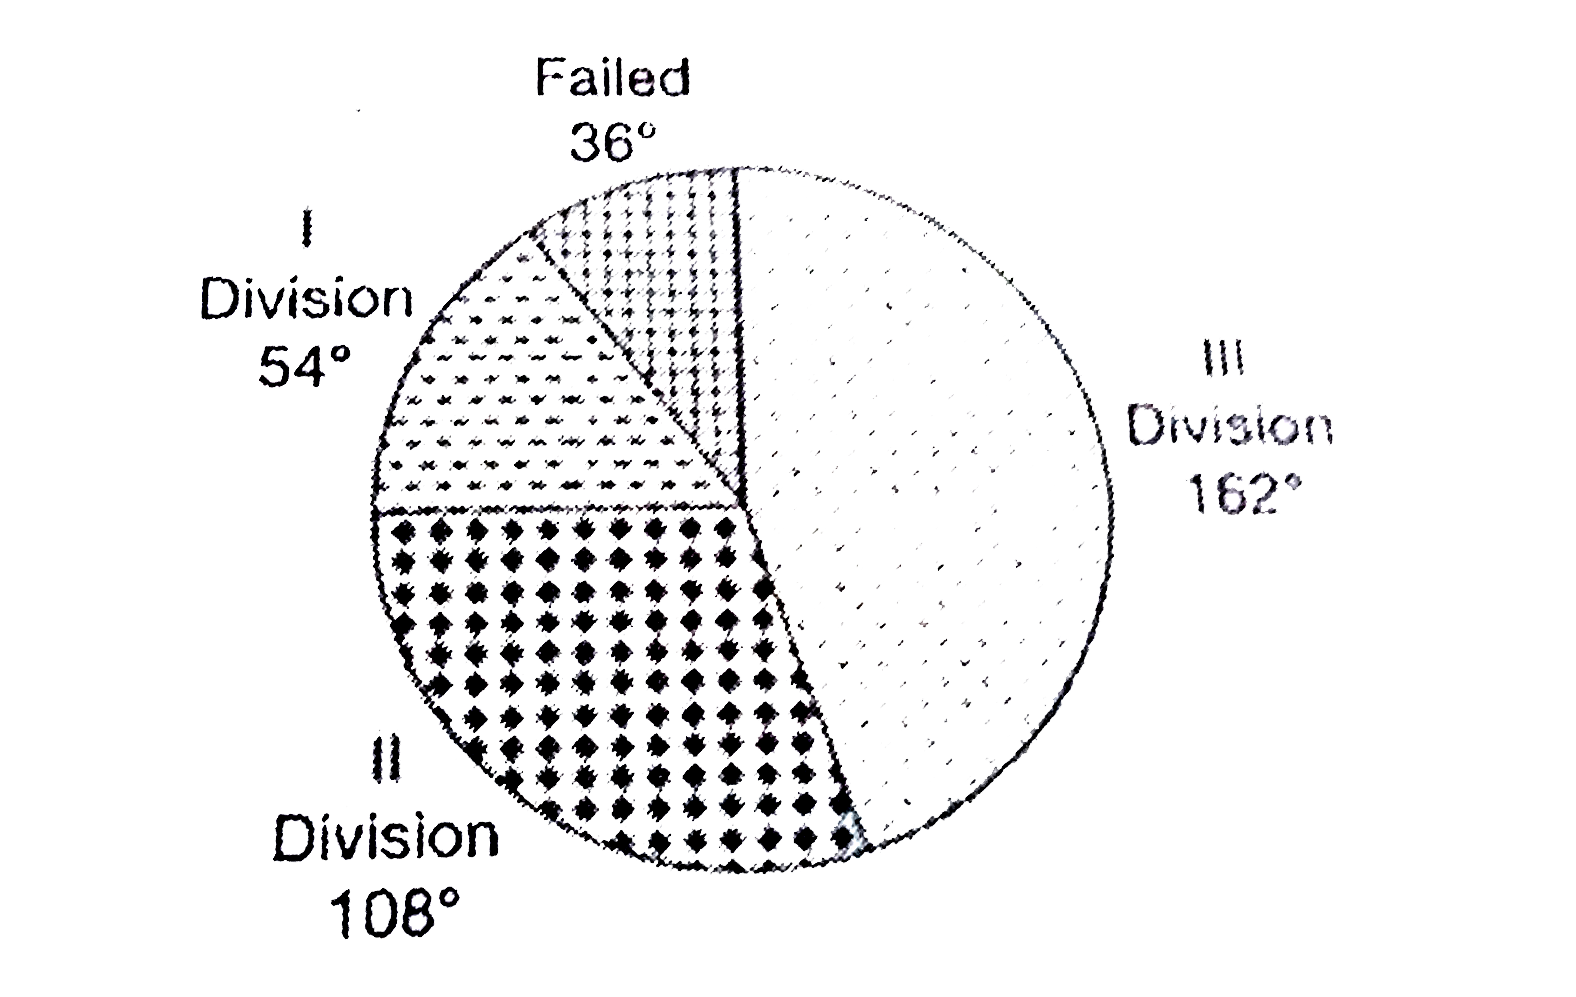
(i) Find the number of students who passed in the first division.
(ii) Find the ratio of number of students who passed to that of failed.
(iii) Find the pecentage of the number of students who failed in the examination.

Text Solution

Verified by Experts

(1) The angle at the centre `=360^(@)`
Angle of sector representing the first division `=54^(@)`
Total number of students = 720
The number of students who passed in the first division `=(54^(@)xx720)/(360)=54xx2=108`
(ii) Angle of sector representing the students who passed in the exam `=324^(@)`
Angle of sector representing failed students `=36^(@)`
The ratio of the number of students who passed who passed to that failed = 324 : 36 = 9 : 1
(iii) The percentage of students who failed in the examination `=(36xx100%)/(360)=10%`
Promotional Banner

Topper's Solved these Questions

  • STATISTICS

    PEARSON IIT JEE FOUNDATION|Exercise EXAMPLE 10.5|1 Videos
  • STATISTICS

    PEARSON IIT JEE FOUNDATION|Exercise EXAMPLE 10.6|1 Videos
  • STATISTICS

    PEARSON IIT JEE FOUNDATION|Exercise EXAMPLE 10.3|1 Videos
  • SETS

    PEARSON IIT JEE FOUNDATION|Exercise Crossword|1 Videos

Similar Questions

Explore conceptually related problems

Study the given pie chart and answer the question that follows The total number of students in schools D and E is what percentage more than the number of students in schools B and C?

1700 students took an exam 85% students passsed it. Find the number of students who failed in the exam.

Study the given pie chart and answer the question that follows If the total number of students in schools D and E exceeds the number of students in school by x, then x lies between

The average marks obtained by 150 students in an examination is 40. If the average marks of passed students is 60 and that of the failed students is 20, then what is the number of students who passed the examination?

The following pie chart shows the performance in an examination in a particular year for 360 students. The number of students who passed in 1st division is