A
B
C
D
Text Solution
Verified by Experts
The correct Answer is:


Topper's Solved these Questions
KINEMATICS
PEARSON IIT JEE FOUNDATION|Exercise EXAMPLE|4 VideosKINEMATICS
PEARSON IIT JEE FOUNDATION|Exercise TEST YOUR CONCEPTS (VERY SHORT ANSWER TYPE QUESTIONS (FILL IN THE BLANKS))|8 VideosKINEMATICS
PEARSON IIT JEE FOUNDATION|Exercise Level 3|6 VideosHEAT
PEARSON IIT JEE FOUNDATION|Exercise Test 2|14 VideosLIGHT
PEARSON IIT JEE FOUNDATION|Exercise ASSESSMENT TEST (TEST 2 (SELECT THE CORRECT ALTERNATIVE))|15 Videos
Similar Questions
Explore conceptually related problems
PEARSON IIT JEE FOUNDATION-KINEMATICS-Test 1
- Choose the correct statement:
Text Solution
|
- Choose the correct statement (s)
Text Solution
|
- Assertion (A): When the length of a pendulum is 100 cm , the length us...
Text Solution
|
- Assertion (A), If the speed of a car moving towards the east is 20 ms...
Text Solution
|
- The time taken by a simple pendulum to complete 20 oscillations is giv...
Text Solution
|
- A farmer moves along a square field of side 10 m in one hour. Write th...
Text Solution
|
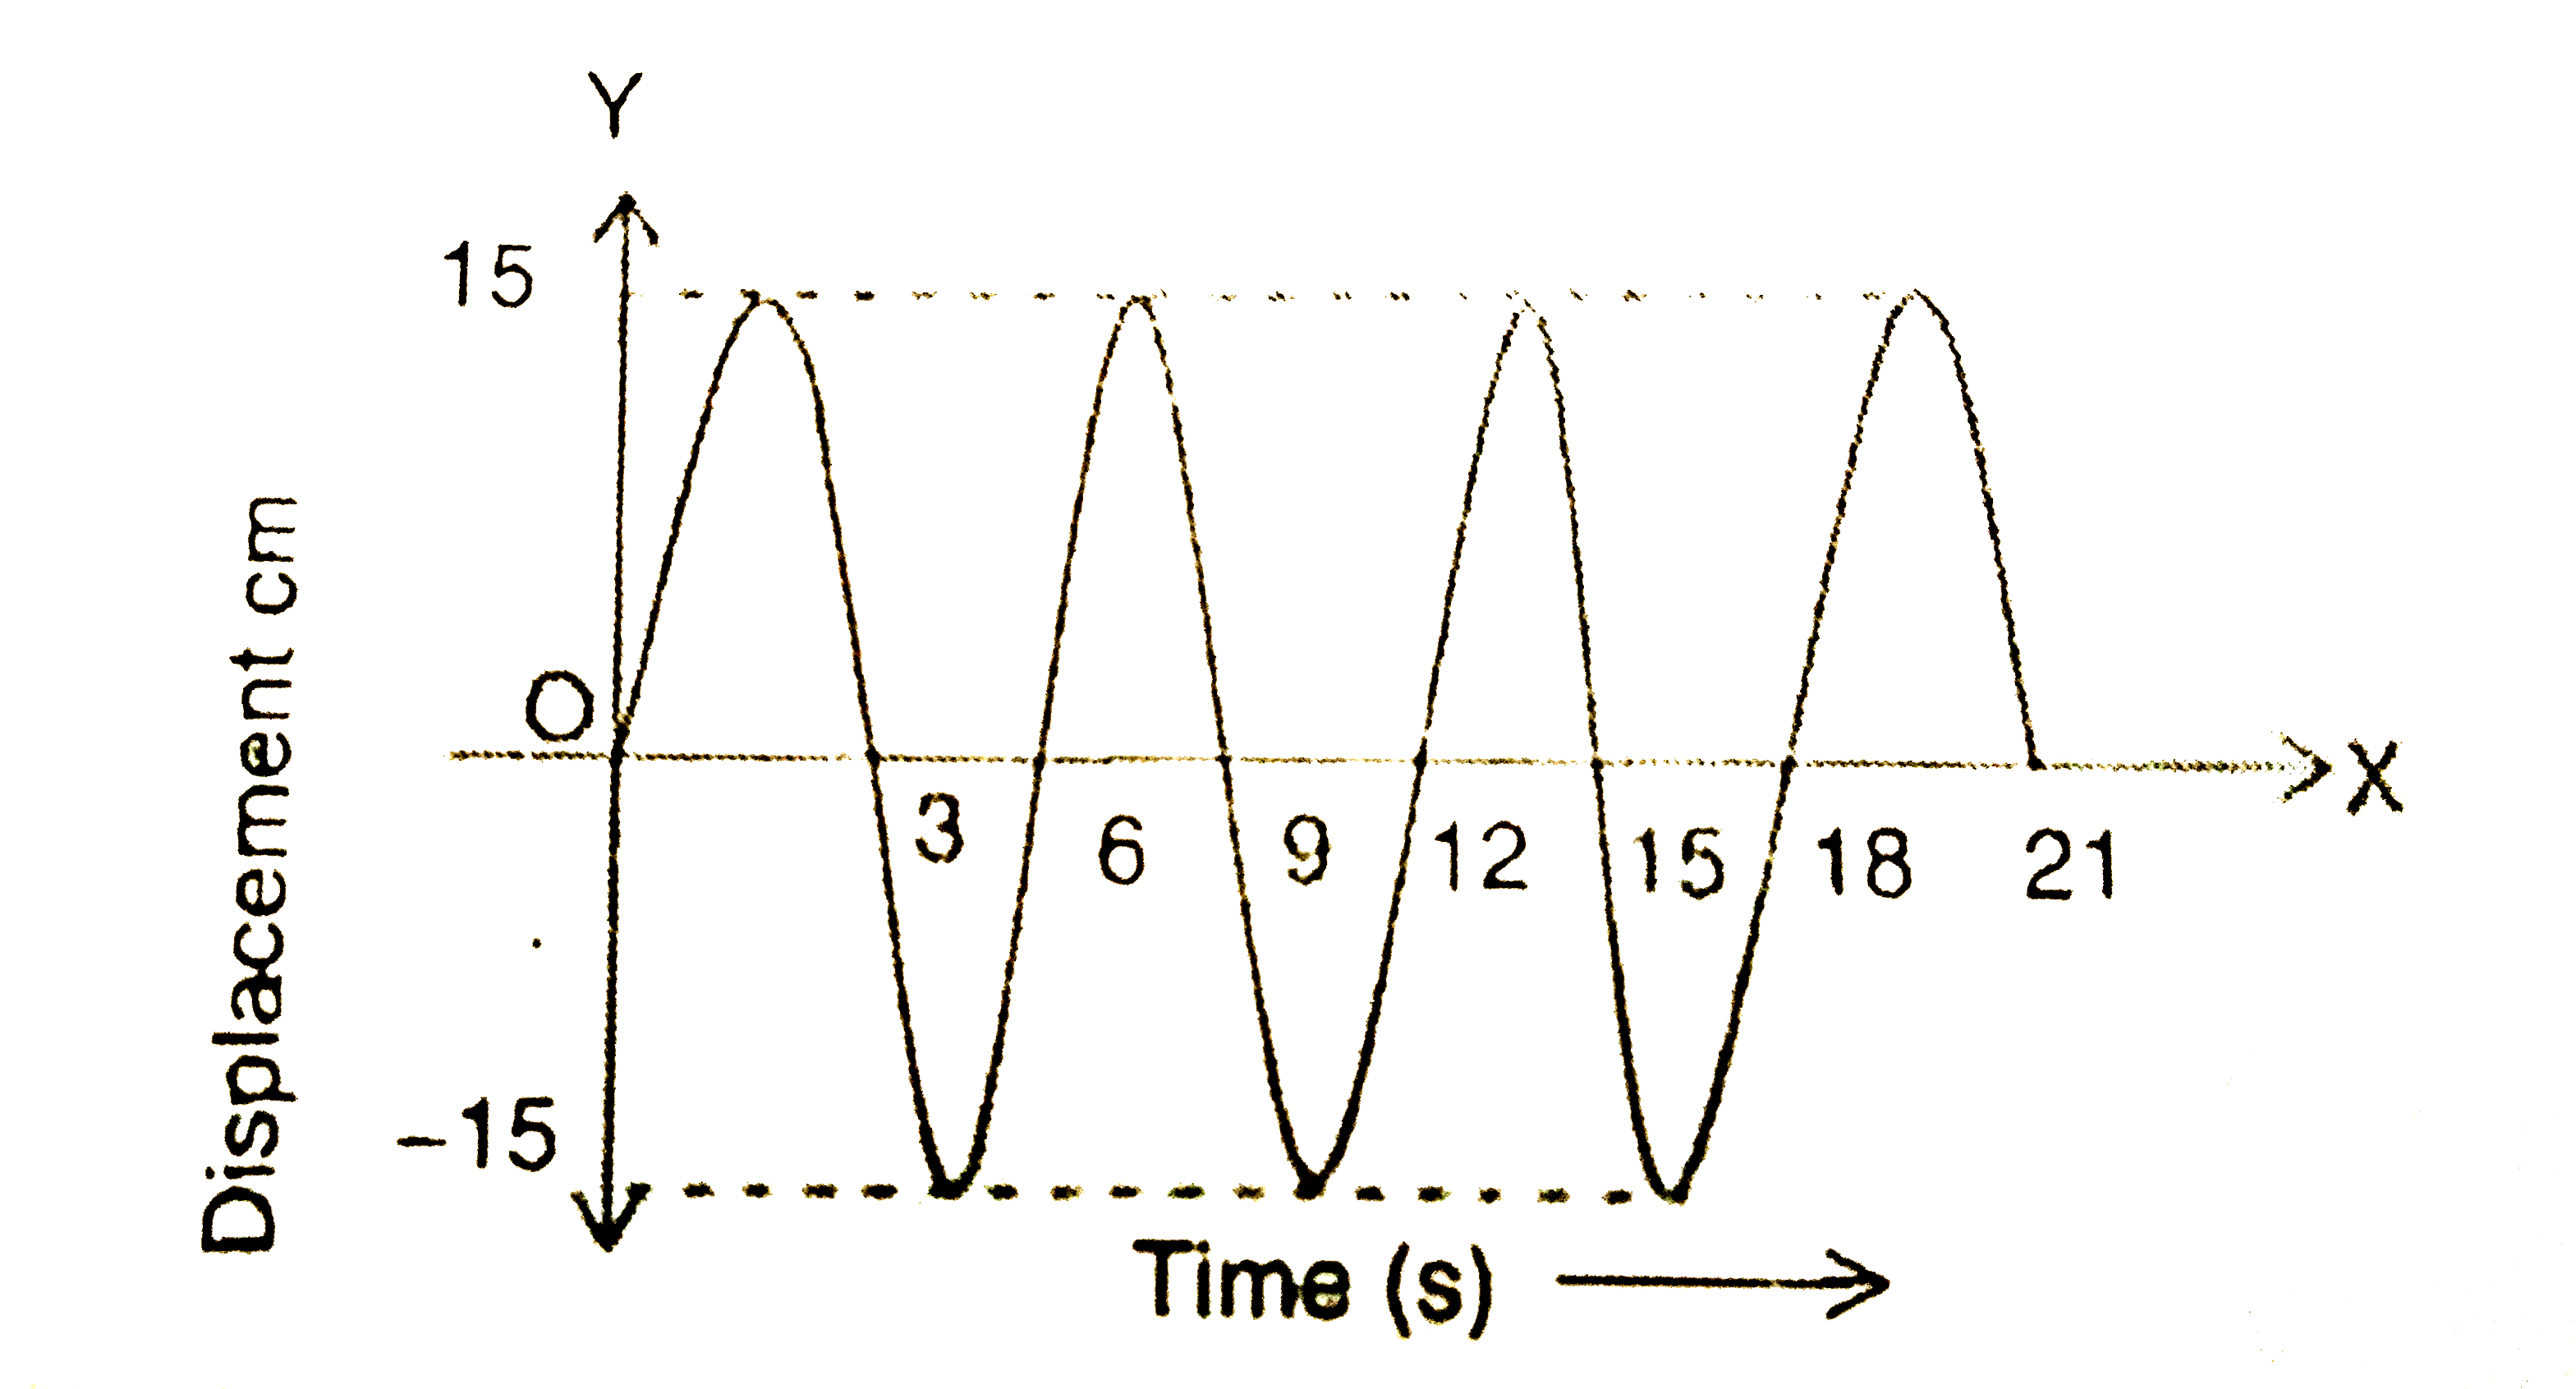
- In the case of a simple pendulum, a graph is drawn between the displac...
Text Solution
|
- In the case of a simple pendulum, a graph is drawn between the displac...
Text Solution
|
- In the case of a simple pendulum, a graph is drawn between the displac...
Text Solution
|
- An electric fan rotates 100 times in 50s. If the of its wing from its ...
Text Solution
|
- A person starts from a point P and travels along a path PQRS as shown ...
Text Solution
|
- The ratiro of unit of accceleration and velocity gives unit of the phy...
Text Solution
|
- The motion of a body is depicted graphically as shown in the given fig...
Text Solution
|
- An object moves the first half of the total distance with a speed of 2...
Text Solution
|
- {:("Column A", "Column B"),((A)"Rest and motion",(a)" car taking a tur...
Text Solution
|