Text Solution
Verified by Experts


Topper's Solved these Questions
DUAL NATURE OF RADIATION AND MATTER
MODERN PUBLICATION|Exercise Tough & Tricky PROBLEMS|6 VideosDUAL NATURE OF RADIATION AND MATTER
MODERN PUBLICATION|Exercise NCERT FILE (Textbook Exercises)|19 VideosDUAL NATURE OF RADIATION AND MATTER
MODERN PUBLICATION|Exercise PRACTICE PROBLEMS - 3|6 VideosCURRENT ELECTRICITY
MODERN PUBLICATION|Exercise Chapter Practice Test|15 VideosELECTRIC CHARGES AND FIELDS
MODERN PUBLICATION|Exercise Chapter Practice Test|15 Videos
Similar Questions
Explore conceptually related problems
MODERN PUBLICATION-DUAL NATURE OF RADIATION AND MATTER -Conceptual Questions
- Two photosensitive X and Y are exposed to radiations of frequency 10^(...
Text Solution
|
- In the previous problem , which surface will require less energy to em...
Text Solution
|
- A photosensitive surface ejects electrons when green light is incident...
Text Solution
|
- How will photoelectric current through a photoelectric cell change on ...
Text Solution
|
- How will stopping potential of a photoelectric cell change on decreasi...
Text Solution
|
- The following graph shows the variation of stopping potential V0 with ...
Text Solution
|
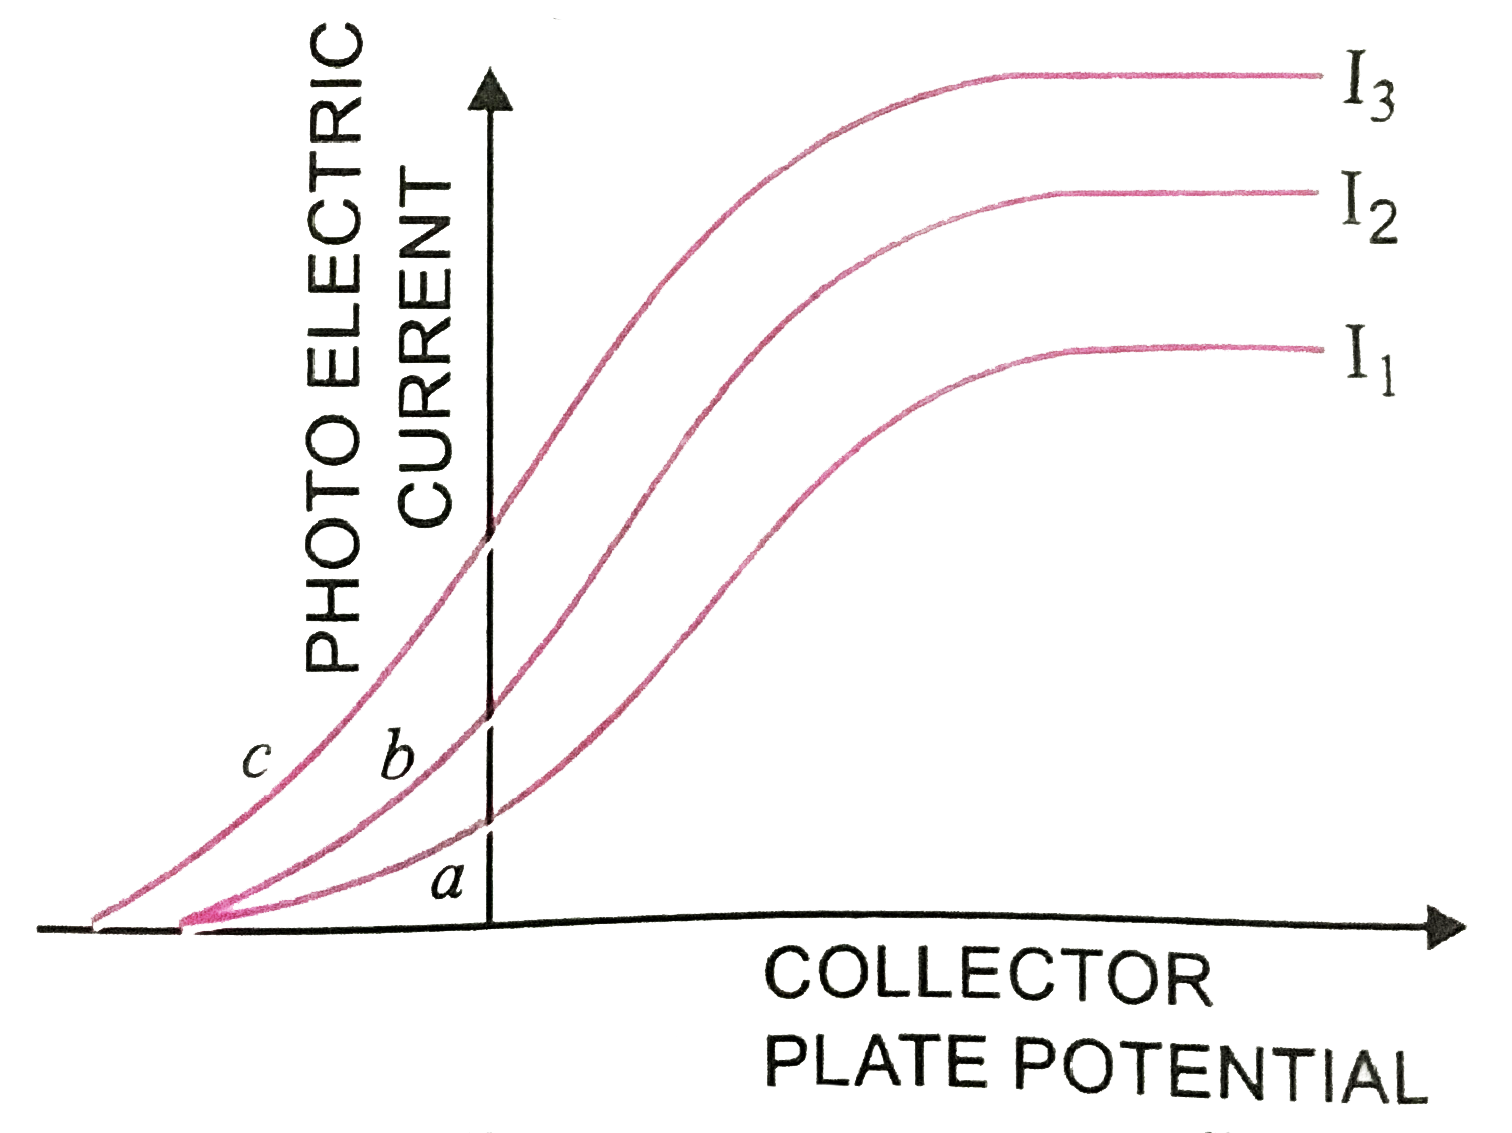
- The Fig shows a plot of three curves a, b, c showing the variation of ...
Text Solution
|
- A 20 W lamp rated 10% emits light of wavelength y. Calculate the numbe...
Text Solution
|
- The de Broglie wavelength of an electron and wavelength of a radiation...
Text Solution
|
- Alkali metals are used in photoelectric cells and photoelectric alarms...
Text Solution
|
- Which among the ultraviolet rays or infrared rays will easily remove t...
Text Solution
|
- Is there any difference between light waves and matter waves?
Text Solution
|
- A proton and an alphaparticle are accelerated through the same potenti...
Text Solution
|