Text Solution
Verified by Experts


Topper's Solved these Questions
NUCLEI
MODERN PUBLICATION|Exercise NCERT FILE SOLVED (NCERT EXEMPLAR PROBLEMS SUBJECTIVE QUESTIONS (SHORT ANSWER TYPE QUESTIONS))|5 VideosNUCLEI
MODERN PUBLICATION|Exercise HIGH ORDER THINKING SKILLS & ADVANCED LEVEL|9 VideosNUCLEI
MODERN PUBLICATION|Exercise NCERT FILE SOLVED (NCERT ADDITIONAL EXERCISES)|9 VideosMOVING CHARGES AND MAGNETISM
MODERN PUBLICATION|Exercise CHAPTER PRACTICE TEST|13 VideosRAY OPTICS AND OPTICAL INSTRUMENTS
MODERN PUBLICATION|Exercise CHAPTER PRACTICE TEST|14 Videos
Similar Questions
Explore conceptually related problems
MODERN PUBLICATION-NUCLEI-NCERT FILE SOLVED (NCERT EXEMPLAR PROBLEMS SUBJECTIVE QUESTIONS) (VERY SHORT ANSWER TYPE QUESTIONS)
- He(2)^(3) and He(1)^(3) nuclei have the same mass number. Do they have...
Text Solution
|
- Draw a graph showing the variation of decay rate with number of active...
Text Solution
|
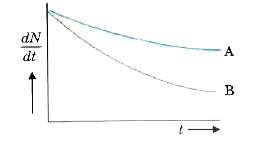
- Which sample, A or B, shown in the following figure has shorter mean l...
Text Solution
|
- Which one of the following cannot emit radiation and why ? Excited nuc...
Text Solution
|
- In pair annihilation an electron and a position destroy each other to ...
Text Solution
|