Home
Class 14
MATHS
Directions (Q. Nos. 16-20) The fallowing...

Directions (Q. Nos. 16-20) The fallowing is a horizontal bar diagram showing the accidents in which two wheelers are involved with other objects. Study the diagram and answer the questions.

If the data of the bar diagram is represented by a pie chart and the angle of a sector of the pie chart is `36^(@)` , then this sector represents the accidents involving

A

buses

B

stationary vehicles

C

pedestrians

D

bicycles

Text Solution

Verified by Experts

The correct Answer is:
B
Promotional Banner

Topper's Solved these Questions

  • MIXED GRAPH

    ARIHANT SSC|Exercise Higher Skill Level Questions|15 Videos
  • MIXED GRAPH

    ARIHANT SSC|Exercise Higher Skill Level Questions|15 Videos
  • MENSURATION

    ARIHANT SSC|Exercise TEST OF YOUR LEARNING|18 Videos
  • MIXTURE OR ALLIGATION

    ARIHANT SSC|Exercise HIGHER SKILL LEVEL QUESTIONS|16 Videos

Similar Questions

Explore conceptually related problems

Directions (Q. Nos. 16-20) The fallowing is a horizontal bar diagram showing the accidents in which two wheelers are involved with other objects. Study the diagram and answer the questions. 60% of the accidents are caused due to

Directions (Q. Nos. 16-20) The fallowing is a horizontal bar diagram showing the accidents in which two wheelers are involved with other objects. Study the diagram and answer the questions. . The percentage of accidents in pedestrians and cyclists are involved is

The following is a horizontal bar diagram showing the accidents in which two-wheelers are involved with other objects. Study the diagram and answer the questions. The percentage of accidents in which pedestrains and cyclists are involved is

Directions (Q. Nos. 16-20) The fallowing is a horizontal bar diagram showing the accidents in which two wheelers are involved with other objects. Study the diagram and answer the questions. The percentage by which the accidents involving buses is less than the accidents in involving tankers lorry is

The following is a horizontal bar diagram showing the accidents in which two-wheelers are involved with other objects. Study the diagram and answer the questions. The difference in percentage between the accidents involving two-wheeler and other objects is respectively.

Study the pie-chart and answer the questions. The central angle for the sector on "Paper-Cost" is

ARIHANT SSC-MIXED GRAPH-Exercise Base Level Questions
  1. Directions (Q. Nos. 1 - 5) Study the following graph and pie chart car...

    Text Solution

    |

  2. Directions (Q. Nos. 1 - 5) Study the following graph and pie chart car...

    Text Solution

    |

  3. Directions (Q. Nos. 1 - 5) Study the following graph and pie chart car...

    Text Solution

    |

  4. Directions (Q. Nos. 1 - 5) Study the following graph and pie chart car...

    Text Solution

    |

  5. Directions (Q. Nos. 1 - 5) Study the following graph and pie chart car...

    Text Solution

    |

  6. Directions (Q. Nos. 6-15) Study the following pie charts and table to ...

    Text Solution

    |

  7. Directions (Q. Nos. 6-15) Study the following pie charts and table to ...

    Text Solution

    |

  8. Directions (Q. Nos. 6-15) Study the following pie charts and table to ...

    Text Solution

    |

  9. Directions (Q. Nos. 6-15) Study the following pie charts and table to ...

    Text Solution

    |

  10. Directions (Q. Nos. 6-15) Study the following pie charts and table to ...

    Text Solution

    |

  11. Directions (Q. Nos. 6-15) Study the following pie charts and table to ...

    Text Solution

    |

  12. Directions (Q. Nos. 6-15) Study the following pie charts and table to ...

    Text Solution

    |

  13. Directions (Q. Nos. 6-15) Study the following pie charts and table to ...

    Text Solution

    |

  14. Directions (Q. Nos. 6-15) Study the following pie charts and table to ...

    Text Solution

    |

  15. Directions (Q. Nos. 6-15) Study the following pie charts and table to ...

    Text Solution

    |

  16. Directions (Q. Nos. 16-20) The fallowing is a horizontal bar diagram s...

    Text Solution

    |

  17. Directions (Q. Nos. 16-20) The fallowing is a horizontal bar diagram s...

    Text Solution

    |

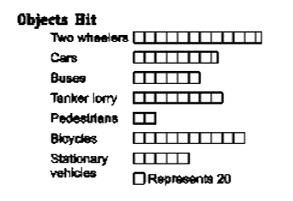
  18. The following is a horizontal bar diagram showing the accidents in whi...

    Text Solution

    |

  19. Directions (Q. Nos. 16-20) The fallowing is a horizontal bar diagram s...

    Text Solution

    |

  20. Directions (Q. Nos. 16-20) The fallowing is a horizontal bar diagram s...

    Text Solution

    |