A
B
C
D
Text Solution
Verified by Experts
The correct Answer is:


Topper's Solved these Questions
MOTION IN A STRAIGHT LINE
MODERN PUBLICATION|Exercise HIGHER ORDER THINKING SKILL AND ADVANCED LEVEL QUESTION WITH ANSWER|5 VideosMOTION IN A STRAIGHT LINE
MODERN PUBLICATION|Exercise REVISION EXERCISE (VERY SHORT ANSWER QUESTION)|40 VideosMOTION IN A STRAIGHT LINE
MODERN PUBLICATION|Exercise NCERT (MULTIPLE CHOICE QUESTION (TYPE-I))|6 VideosMOTION IN A PLANE
MODERN PUBLICATION|Exercise Chapter Practice Test|15 VideosOSCILLATIONS
MODERN PUBLICATION|Exercise Practice Test (For Board Examination)|12 Videos
Similar Questions
Explore conceptually related problems
MODERN PUBLICATION-MOTION IN A STRAIGHT LINE -NCERT (MULTIPLE CHOICE QUESTION (TYPE-II))
- The variation of quantity A with quantity B, plotted in the figure , d...
Text Solution
|
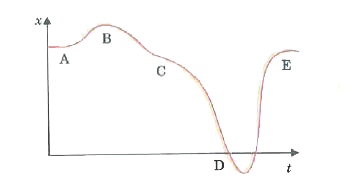
- A graph of x verus t is shown in the figure given below. Choose c...
Text Solution
|
- For the one dimensional motion, described by x=t-sint
Text Solution
|
- A spring with one end attached to a mass and the other to a right supp...
Text Solution
|
- A ball is bouncing elastically with a speed 1 m//s between walls of a ...
Text Solution
|