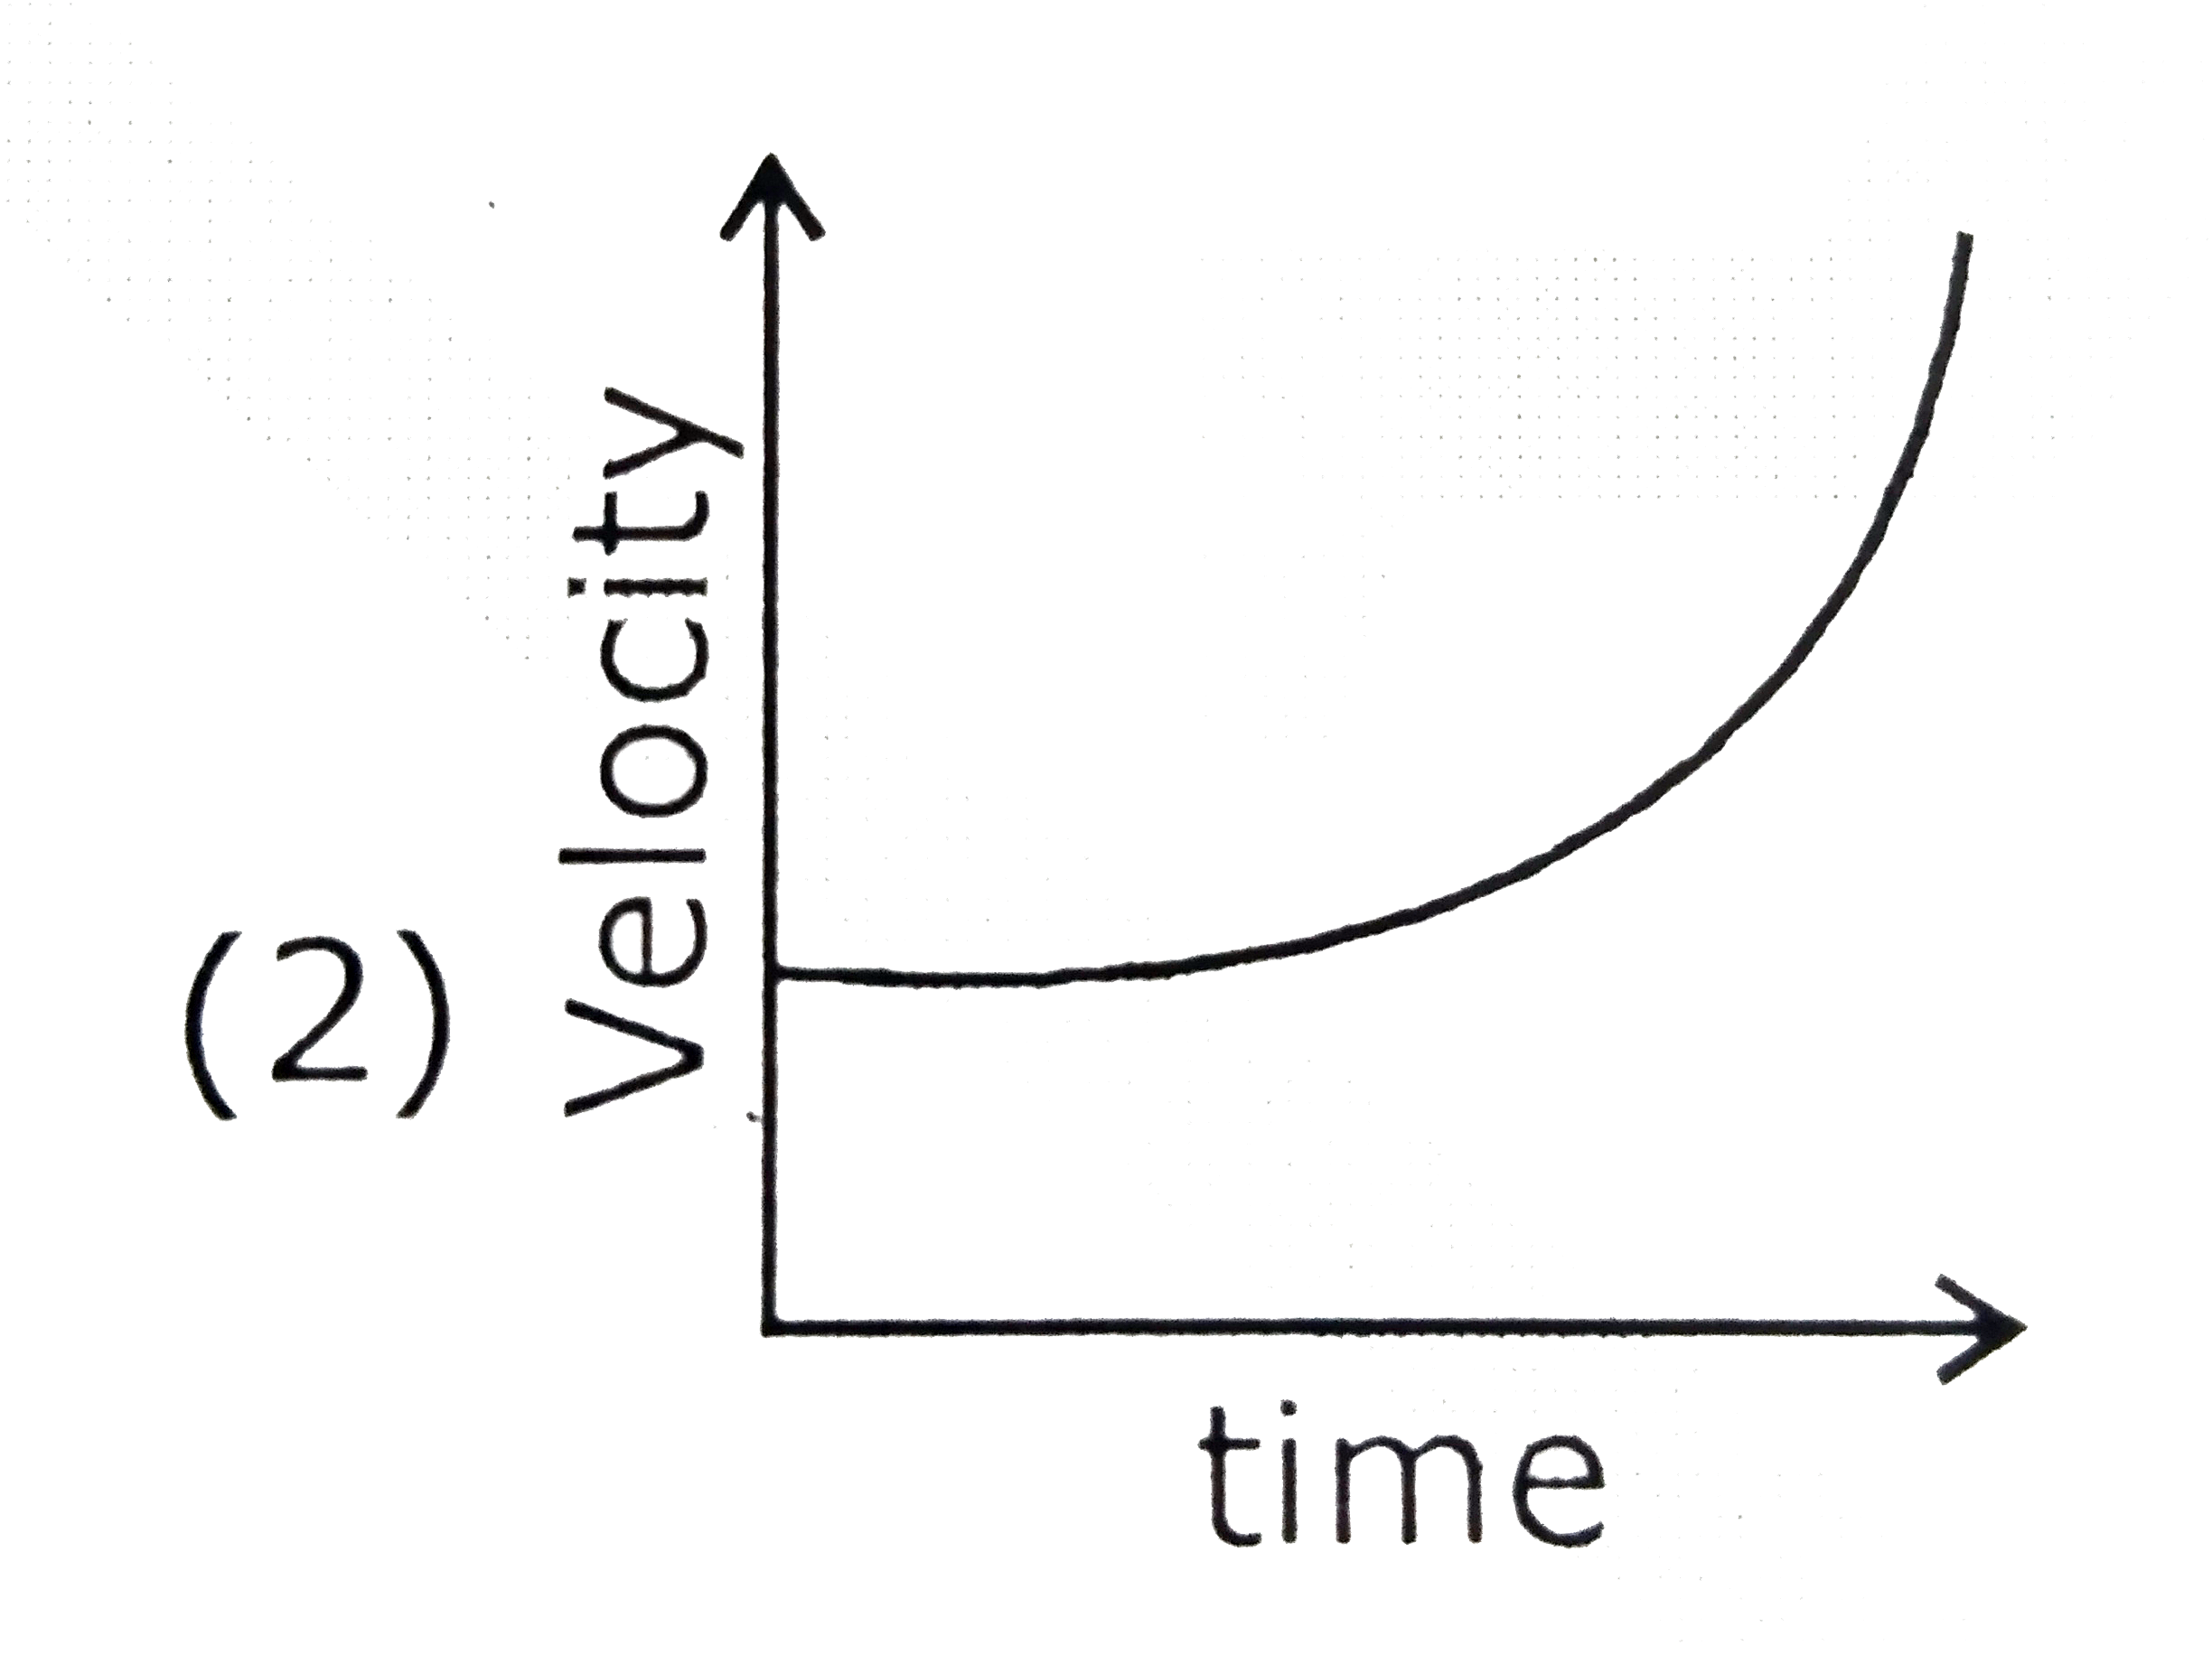
Which graph corresponds to an object moving with a constant negative acceleration and a positive velocity ?
A
B
C
D
Text Solution
AI Generated Solution
The correct Answer is:
To determine which graph corresponds to an object moving with a constant negative acceleration and a positive velocity, we can follow these steps:
### Step-by-Step Solution:
1. **Understanding the Terms**:
- **Constant Negative Acceleration**: This means that the object is slowing down. The acceleration is negative, which indicates that it acts in the opposite direction to the velocity.
- **Positive Velocity**: This means that the object is still moving in the positive direction, but its speed is decreasing due to the negative acceleration.
2. **Mathematical Representation**:
- Let the acceleration be \( a = -c \) (where \( c \) is a positive constant).
- According to the kinematic equations, we can relate acceleration, velocity, and displacement.
3. **Using the Relationship Between Velocity and Displacement**:
- We can use the equation \( v \frac{dv}{dx} = a \).
- Substituting \( a = -c \), we have:
\[
v \frac{dv}{dx} = -c
\]
4. **Separating Variables**:
- Rearranging gives:
\[
v \, dv = -c \, dx
\]
5. **Integrating Both Sides**:
- Integrate both sides:
\[
\int v \, dv = \int -c \, dx
\]
- This results in:
\[
\frac{v^2}{2} = -cx + k
\]
- Rearranging gives:
\[
x = -\frac{v^2}{2c} + \frac{k}{c}
\]
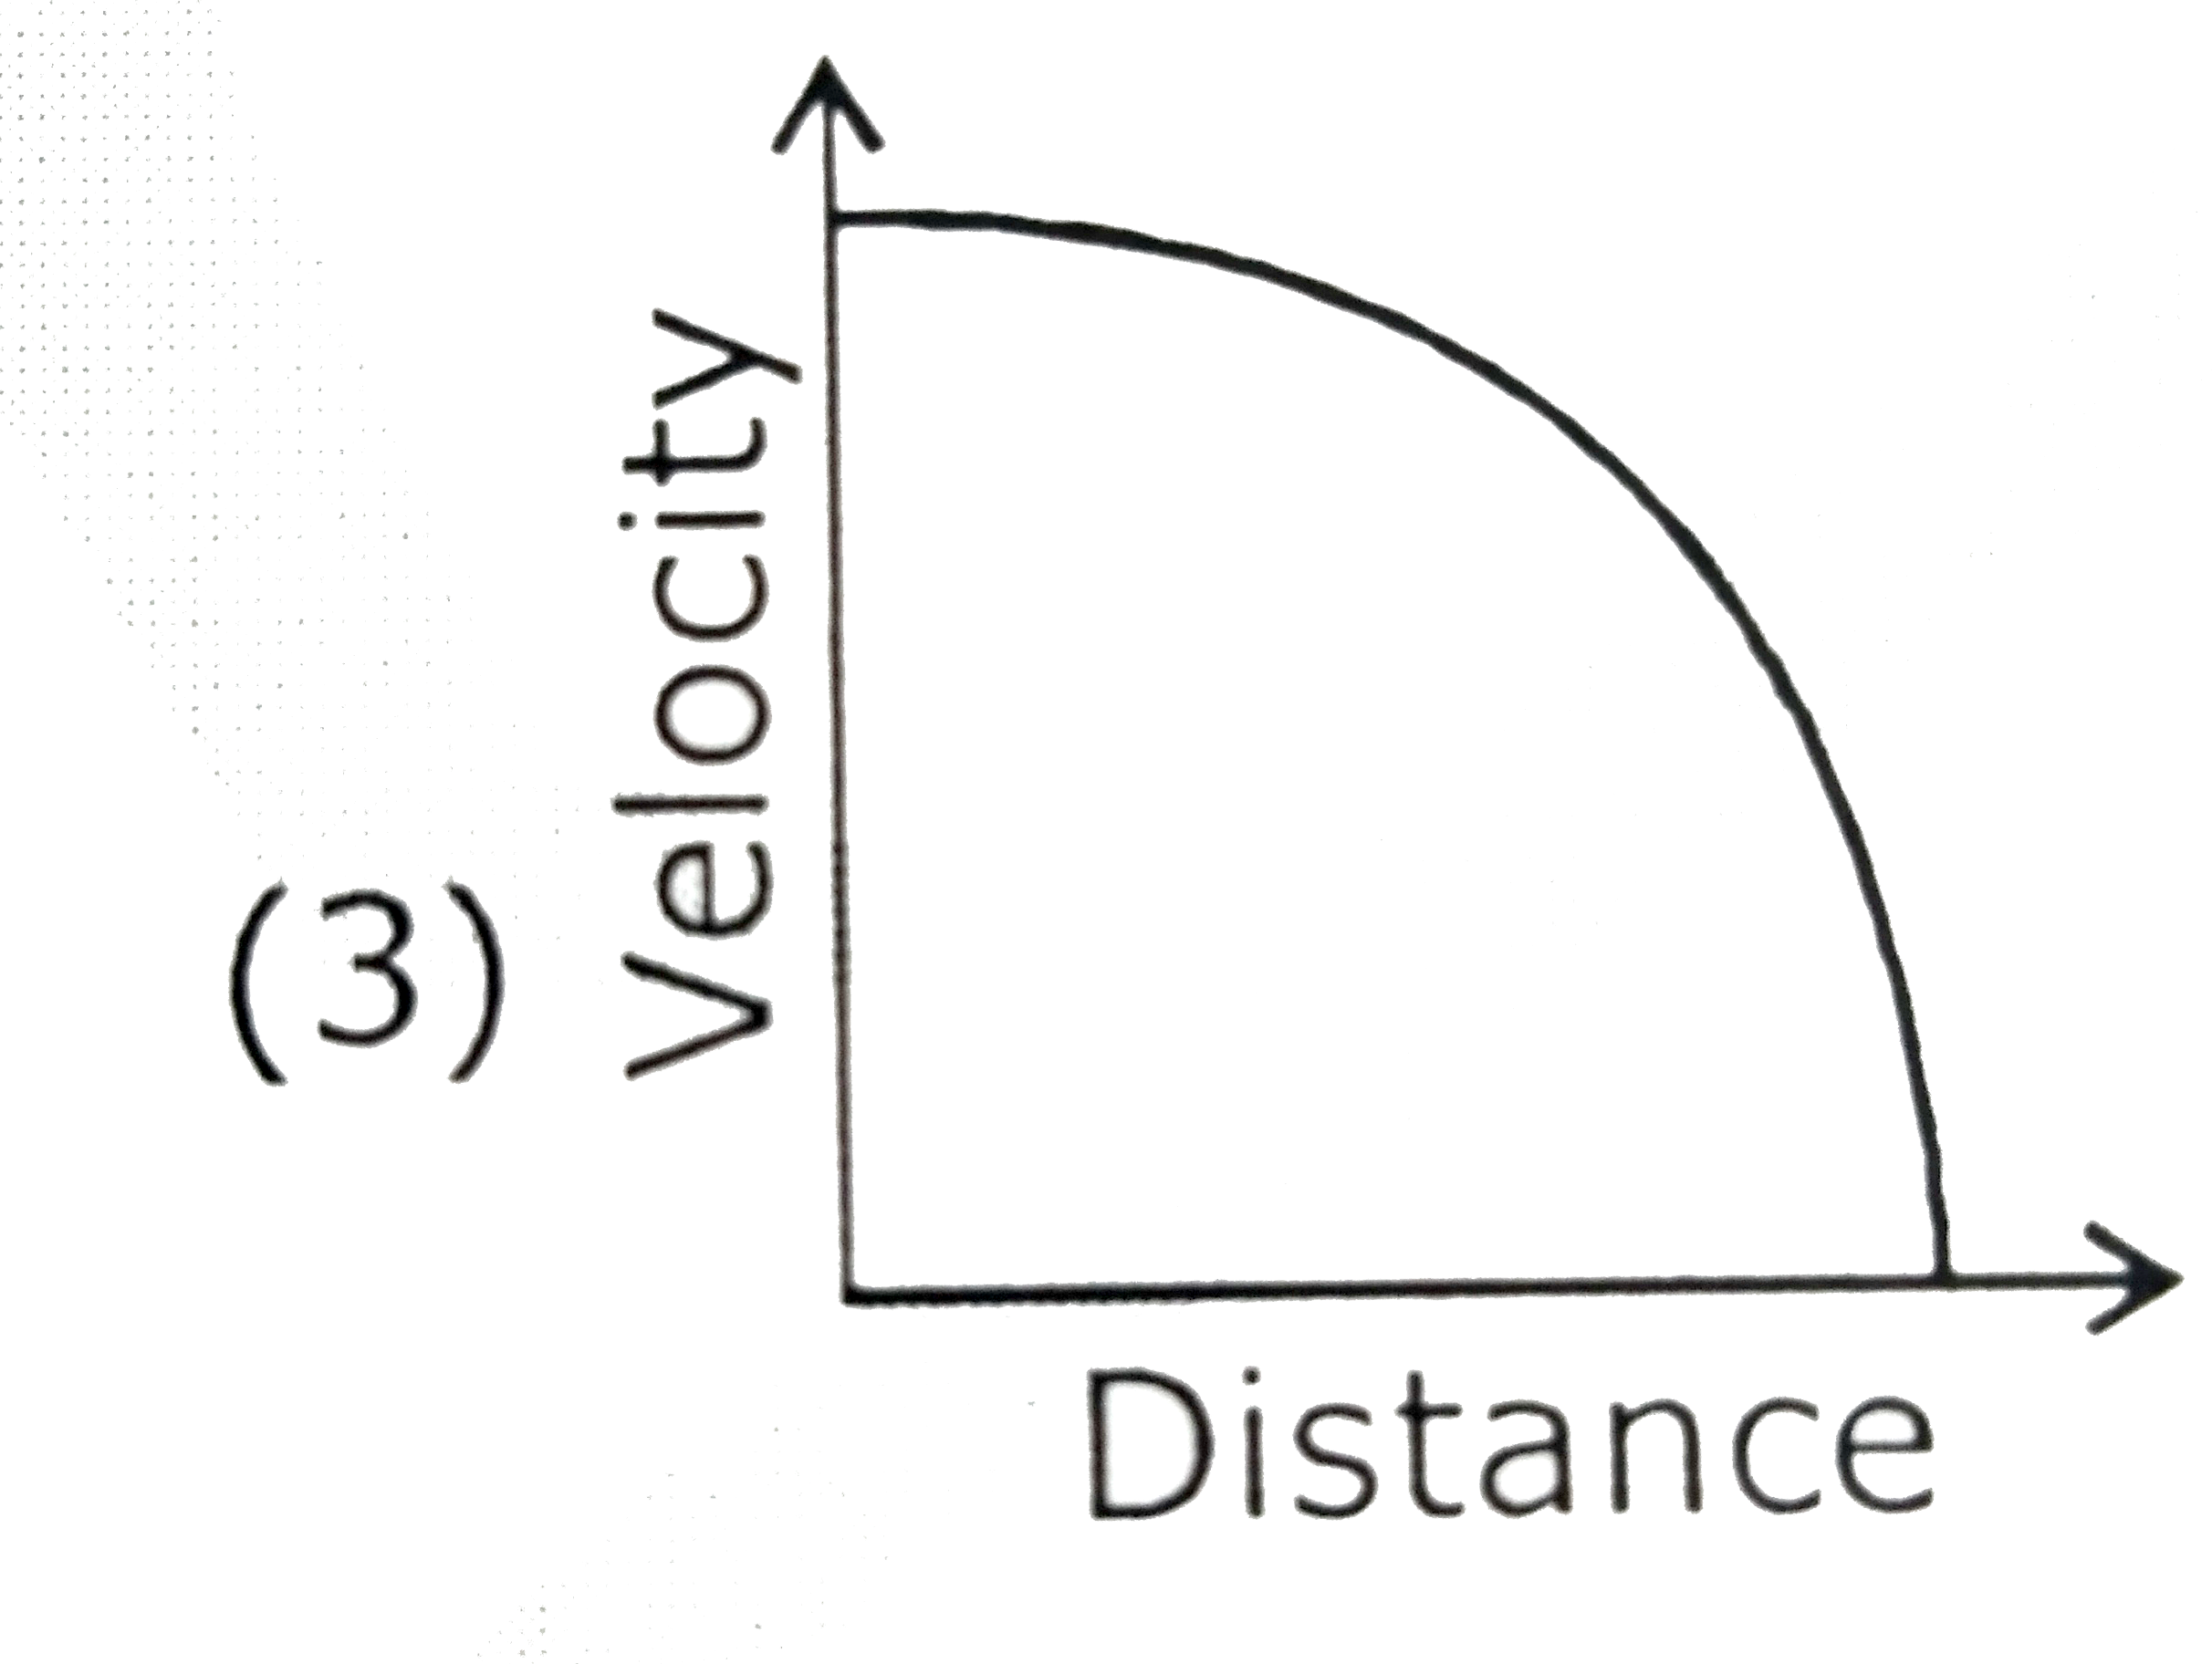
6. **Analyzing the Equation**:
- The equation \( x = -\frac{v^2}{2c} + \frac{k}{c} \) is a quadratic equation in terms of \( v \) and represents a downward-opening parabola.
- As \( v \) decreases (due to negative acceleration), \( x \) will also change, indicating that the object is moving in the positive direction but slowing down.
7. **Graphical Interpretation**:
- The graph will show a downward-opening parabola, indicating that as the displacement \( x \) increases, the velocity \( v \) decreases.
- Therefore, the correct graph corresponds to a curve that starts from a positive value and slopes downwards.
8. **Conclusion**:
- The graph that matches this description is option 3, which shows a downward trend in velocity as displacement increases.
The distance coverd by an object between times t_(1) and t_(2) is given by the area under the v-t gaph between t_(1) and t_(2) Prove this staement for an object moving with negative acceleration and gaving and having a positive velocity at time t_(1) and and negative velocity at time t_(2) .
Which of the following x-t graphs shows an object moving with negative acceleration ?
Which of the following x - t graphs shows an object moving with negative acceleration?
Draw the velocity-time graph of an object moving with uniform negative acceleration.
Draw the position-time graph of an object moving with positive accceleration.
Show that the area under the velocity-time graph of an object moving with constant acceleration in a straight line in certain time interval is equal to the distance covered by the object in that interval.
Show that area under the velocity-time graph of an object moving with constant acceleration in a straight line in certain time interval is equal to the distance covered by the object in the interval.
Position - time graph for motion with negative acceleration is
Draw the velocity-time graph of an object moving with uniform positive acceleration.
A : The area under acceleration - time graph is equal to velocity of object. R : For an object moving with constant acceleration, position - time graph is a straight line.