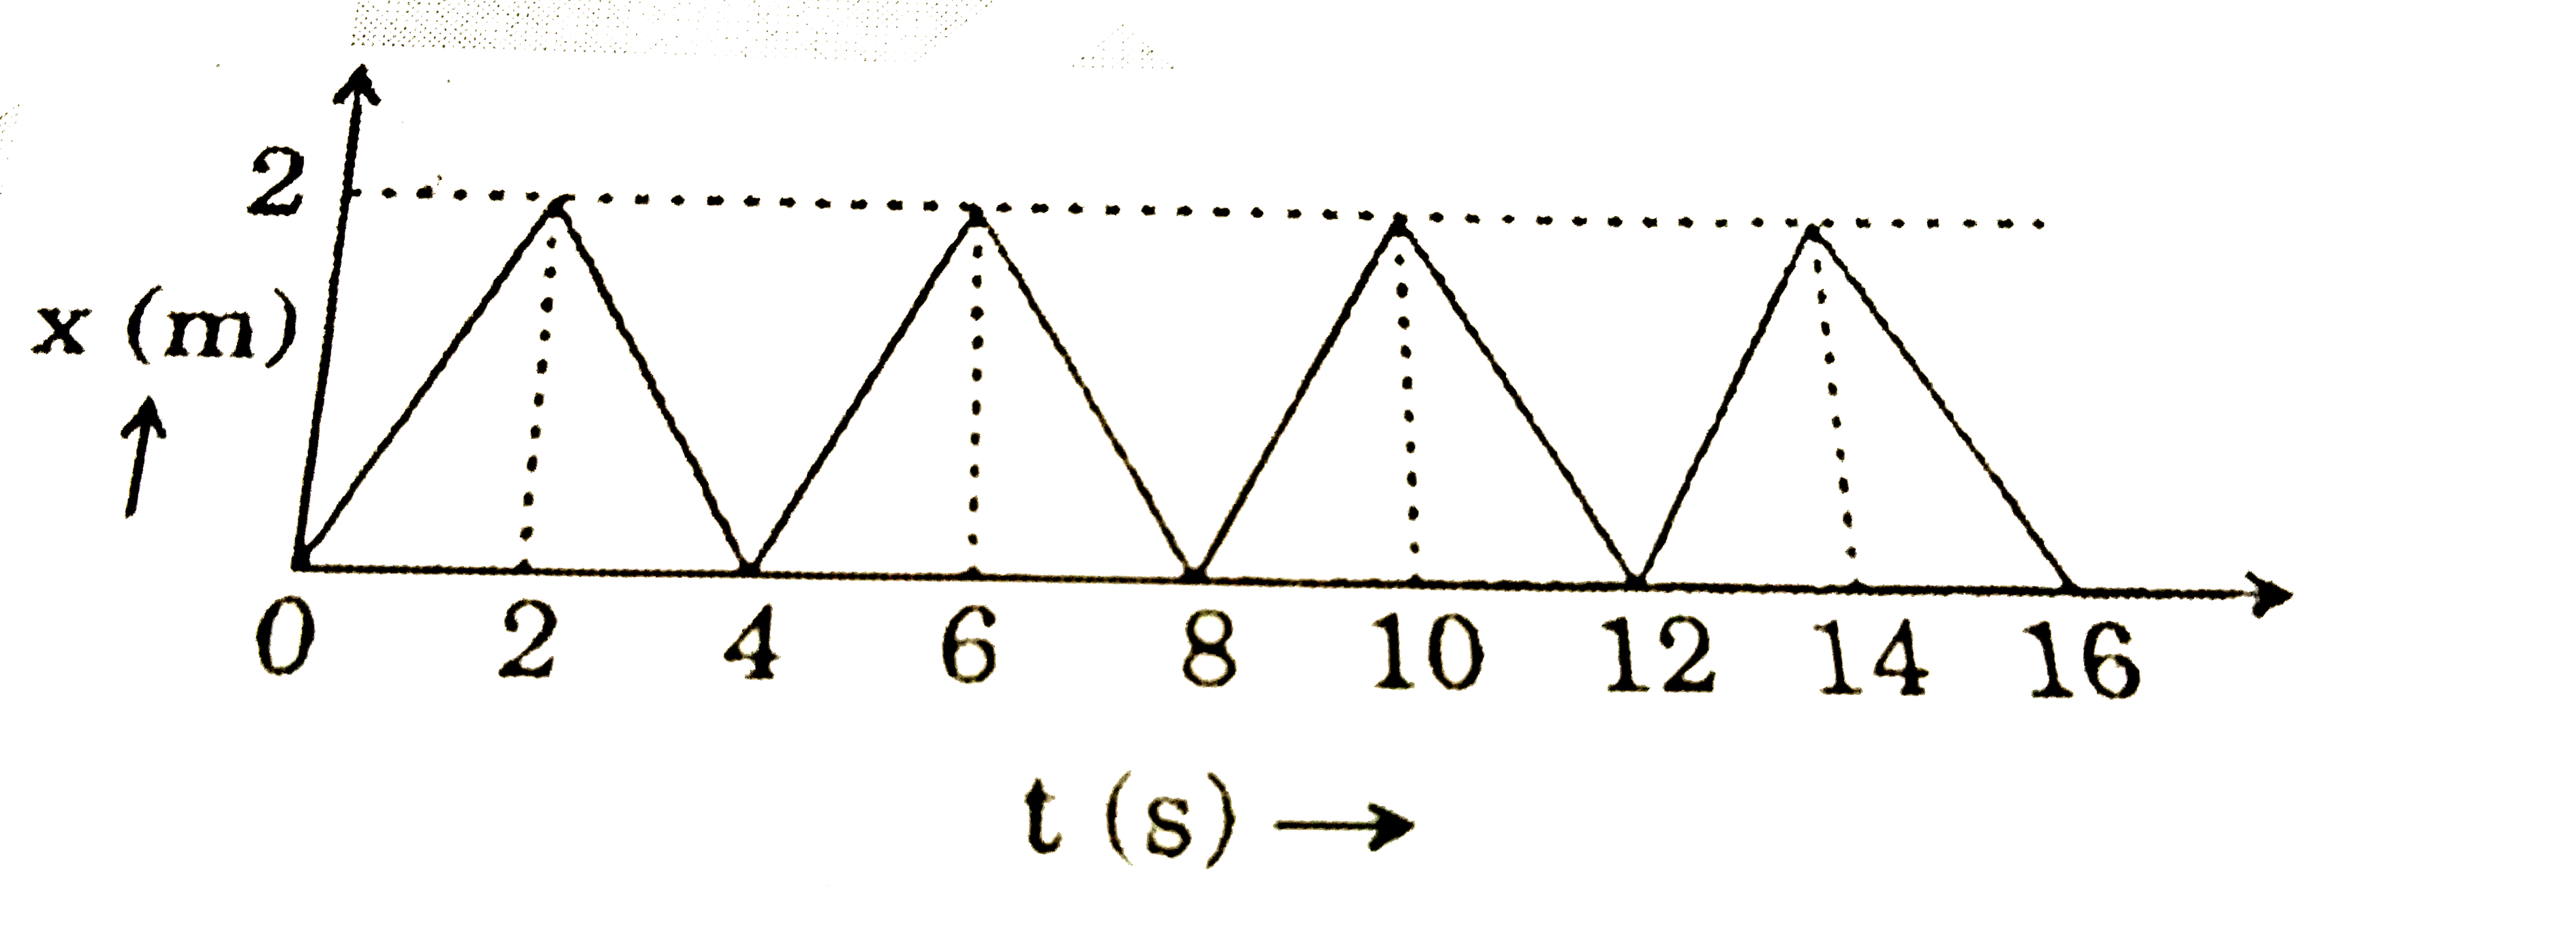
The figure shows the position-time (x-t) graph of one-dimensional motion of a body of mass 0.4kg. The magnitude of each impulse is
The figure shows the position – time (x – t) graph of one – dimensional motion of a body of mass 0.4 kg. The magnitude of each impulse is:
Figure shows the position-time (x-t) graph of one dimensional motion of a mass 500g. What is the time interval between two consecutive impulses received by the body?
Figure shows the position time graph for a particle in one dimensional motion. What is the displacement of the particle in first 4 seconds ?
Figure below shows the velocity-time graph of a one dimensional motion. Which of the following characteristic of the particle is represented by the shaded area?
In the figure given below, the position time graph of a particle of mass 0.1kg is shown. The impulse at t=2 sec is
A body is performing simple harmonic motion of amplitude A and time period T. The figure shown position-time graph of the body . At any time t, acceleration of the body is f, then which of the following graphs is/are appropriate?
The position- time (x - t) graph for motion of a body is given below: Which one among the following is depicted by the above graph?
In the figure given below, the position-time graph of a particle of mass 0.1kg is shown. The impuslse at t=2 sec is