To solve the problem of determining the correct graph for velocity vs time for a body thrown vertically upwards, we can follow these steps:
### Step 1: Understand the motion of the body
When a body is thrown vertically upwards, it initially moves upward with a certain velocity (let's denote this initial velocity as \( v_0 \)). As it rises, it experiences a downward acceleration due to gravity, which is approximately \( g = 9.81 \, \text{m/s}^2 \).
### Step 2: Write the equation of motion
The equation relating velocity, initial velocity, acceleration, and time is given by:
\[
v = v_0 - gt
\]
Here, \( v \) is the velocity at time \( t \), \( v_0 \) is the initial velocity, and \( g \) is the acceleration due to gravity (which is negative in this case because it acts downward).
### Step 3: Analyze the equation
From the equation \( v = v_0 - gt \):
- At \( t = 0 \), \( v = v_0 \) (the initial velocity).
- As time \( t \) increases, the term \( -gt \) becomes larger, causing the velocity \( v \) to decrease.
- Eventually, the velocity will reach zero at the peak of the motion (when the body stops rising).
- After reaching the peak, the velocity will become negative as the body starts to fall back down.
### Step 4: Determine the shape of the graph
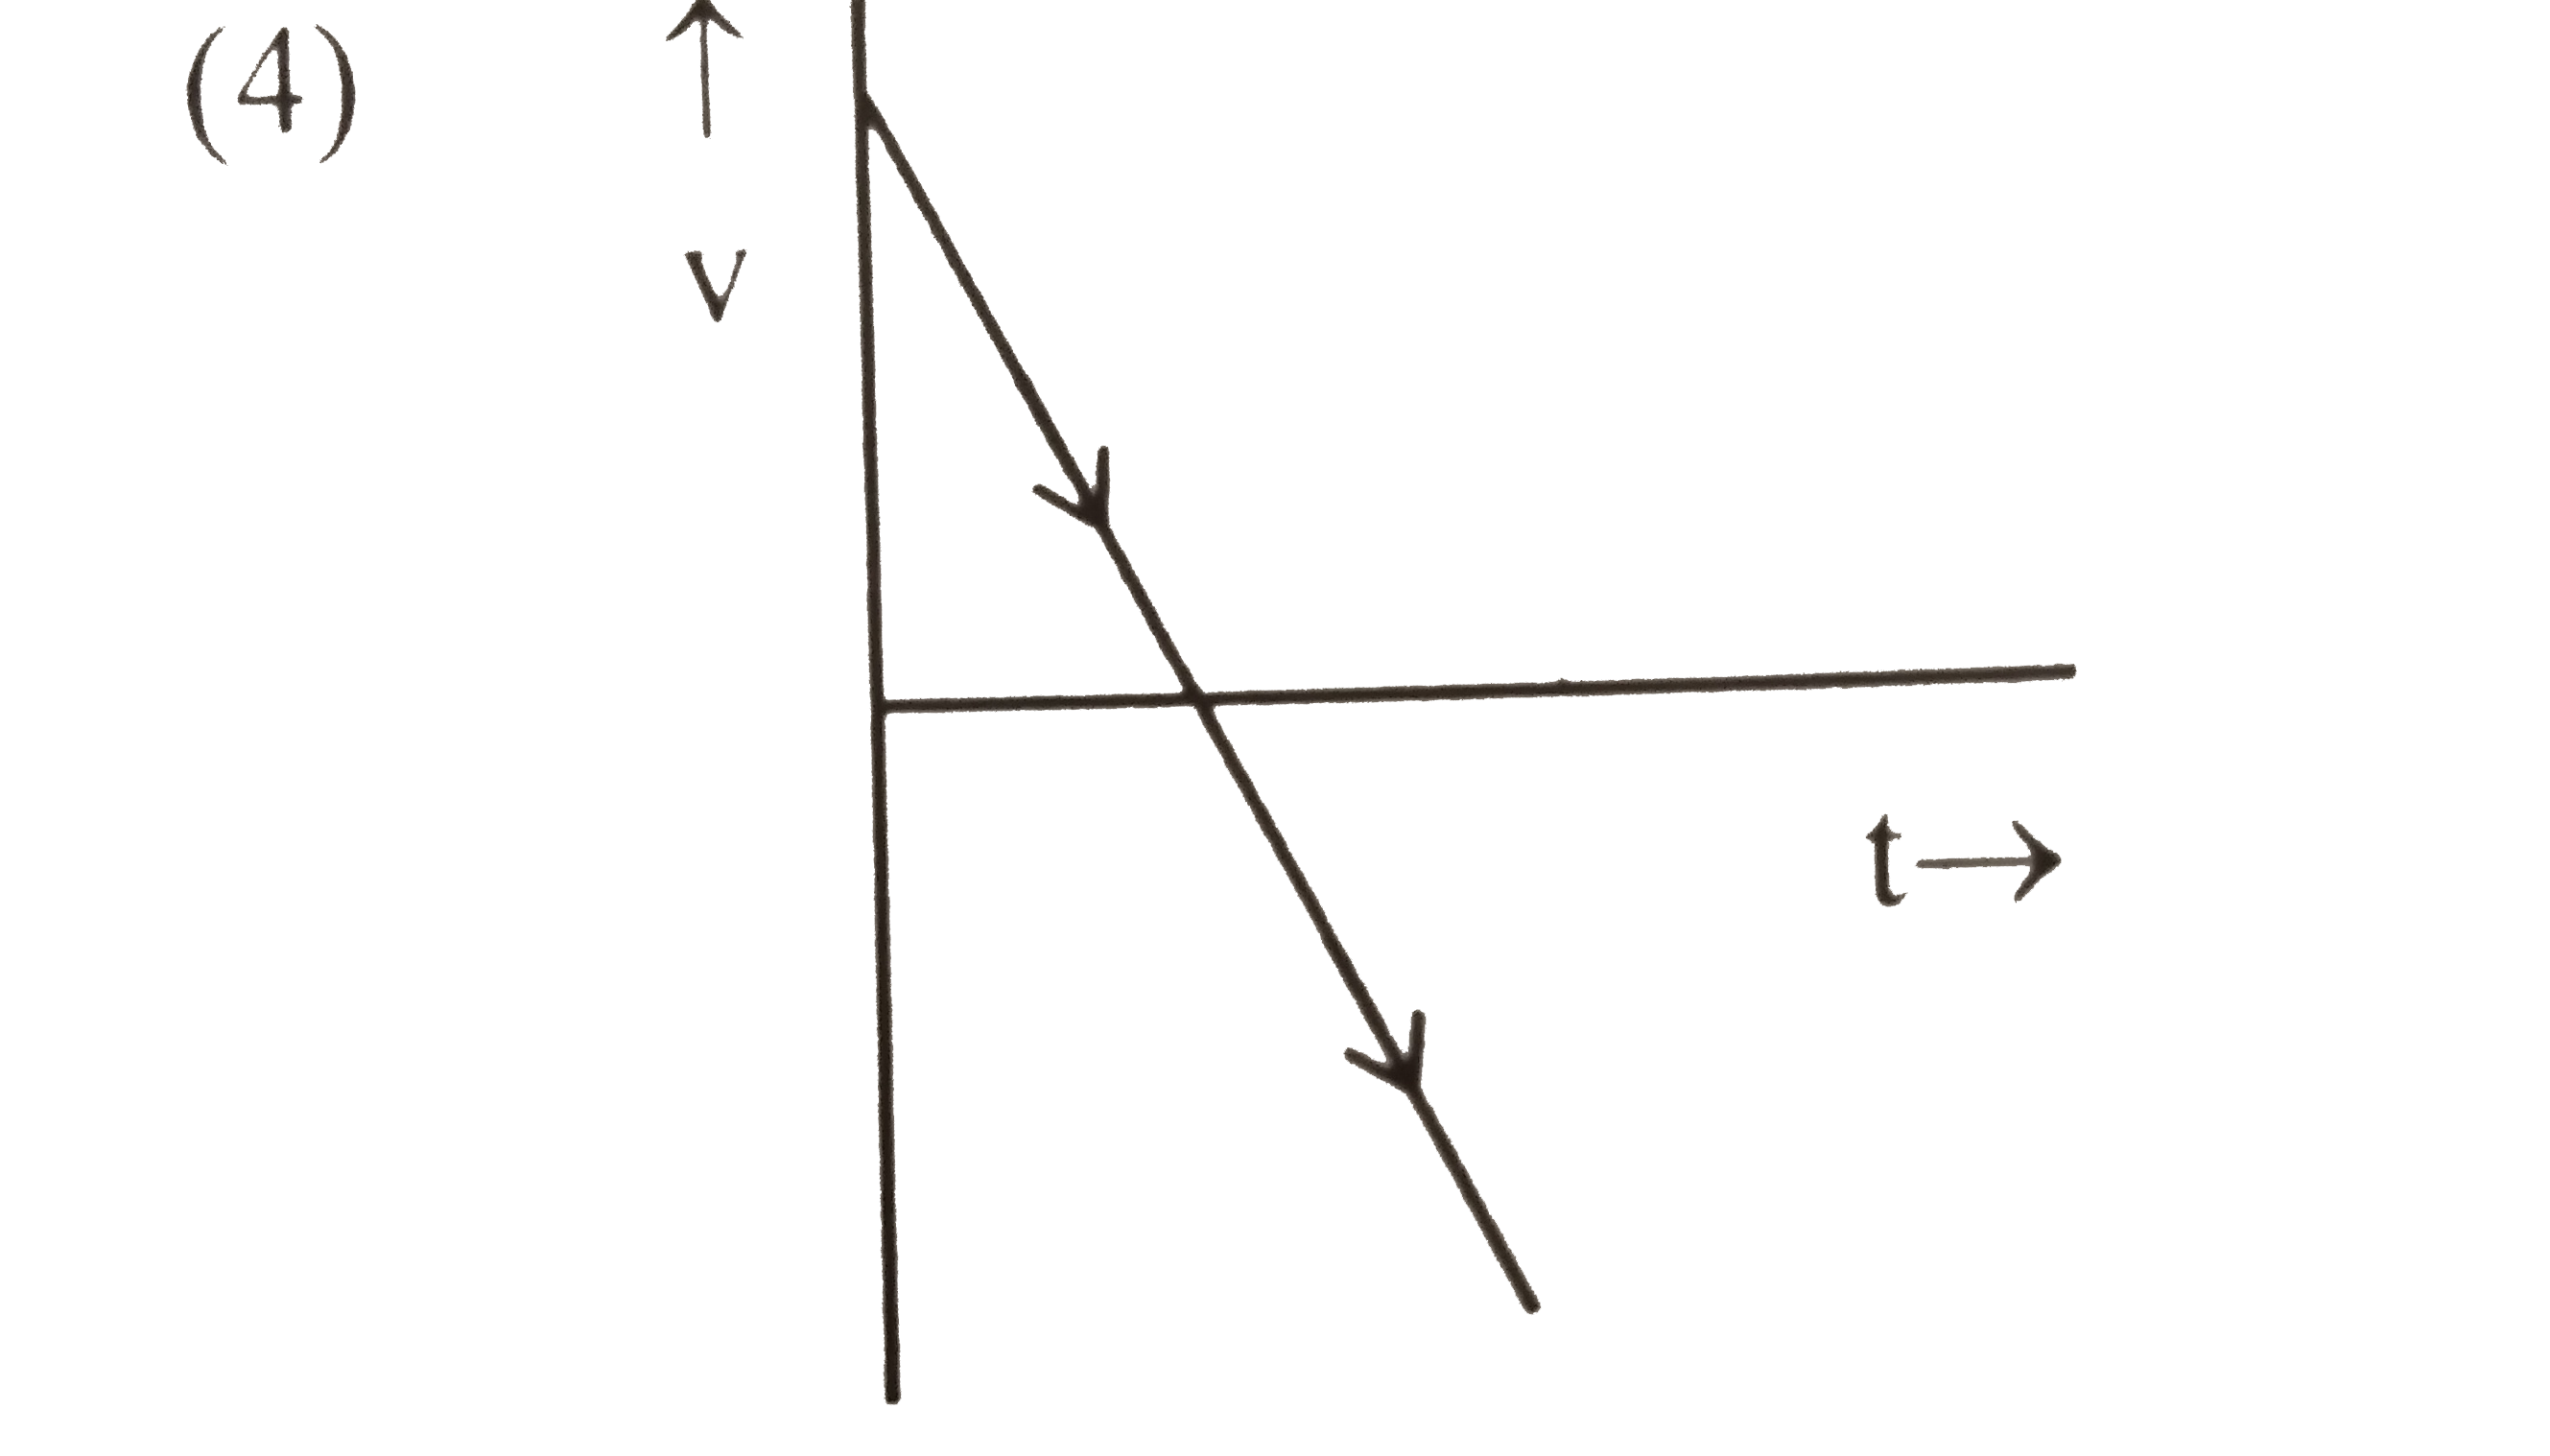
The graph of velocity vs time will be a straight line:
- It starts at \( v_0 \) (positive value) when \( t = 0 \).
- It has a negative slope because the velocity decreases at a constant rate (due to constant acceleration).
- The line will intersect the time axis (velocity = 0) at some point, after which the velocity will be negative as the body falls back down.
### Step 5: Identify the correct graph
Based on the analysis above, the correct graph will be a straight line starting from a positive value (initial velocity) and sloping downwards to cross the time axis (zero velocity) and then continuing into the negative region (negative velocity) as time progresses.
### Conclusion
The correct graph that represents the velocity vs time for a body thrown vertically upwards is a straight line with a negative slope, starting from a positive value and crossing the time axis.