Text Solution
Verified by Experts


Topper's Solved these Questions
Similar Questions
Explore conceptually related problems
NCERT-INTRODUCTION TO GRAPHS-SOLVED EXAMPLES
- (Time and Distance) Ajit can ride a scooter constantly at a speed of 3...
Text Solution
|
- (Principal and Simple Interest)A bank gives 10% Simple Interest (S.I....
Text Solution
|
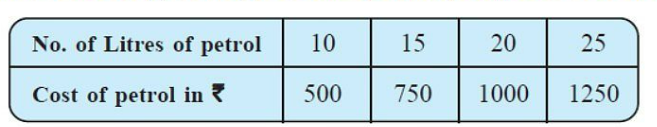
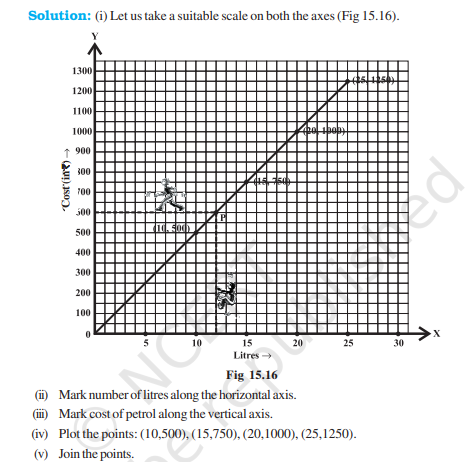
- (Quantity and Cost) The following table gives the quantity of petrol a...
Text Solution
|
- Plot the following points and verify if they lie on a line. If they l...
Text Solution
|
- From Fig 15.14, choose the letter(s) that indicate the location of th...
Text Solution
|
- Plot the point (4, 3) on a graph sheet. Is it the same as the point (...
Text Solution
|
- The given graph (Fig 15.8) describes the distances of a car from a ci...
Text Solution
|
- (A graph on “performance”)The given graph (Fig 15.7) represents the t...
Text Solution
|