A
B
C
D
Text Solution
Verified by Experts
The correct Answer is:


Topper's Solved these Questions
THERMODYNAMICS
MTG-WBJEE|Exercise WB JEE Previous Years Questions|12 VideosTHERMODYNAMICS
MTG-WBJEE|Exercise WB JEE WORKOUT ( CATEGORY 2 : Single Option Correct Type (2 Mark )|15 VideosSOLID STATE ELECTRONS
MTG-WBJEE|Exercise WB JEE Previous Years Questions (CATEGORY 1 : Single Option Correct Type)|15 VideosWAVE OPTICS
MTG-WBJEE|Exercise WB JEE PREVIOUS YEARS QUESTION (MCQ.s)|9 Videos
Similar Questions
Explore conceptually related problems
MTG-WBJEE-THERMODYNAMICS-WB JEE WORKOUT ( CATEGORY 3 : One or Mare than One Option Correct Type (2 Mark )
- The figure shows the P-V plot of an ideal gas taken through a cycle AB...
Text Solution
|
- A gas undergoes change in its state from position A to position B via ...
Text Solution
|
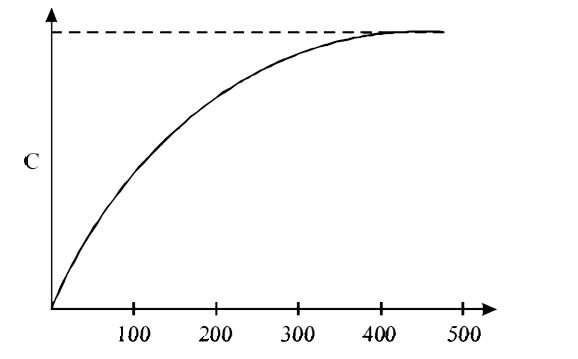
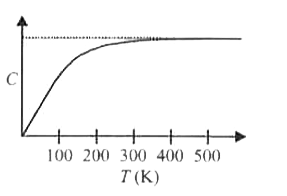
- The figure below shows the variation of specific heat capacity (C) of ...
Text Solution
|
- The given figure shows the P-V diagram for a Camot cycle. In this diag...
Text Solution
|
- A gas is expanded form volume V(0) to 2V(0) under three different pro...
Text Solution
|
- Three processes compose a thermodynamic cycle shown in the accompanyin...
Text Solution
|
- Three moles of an ideal gas C(p) = 7//2 R at pressure P(A) and tempera...
Text Solution
|
- An ideal gas (1 mol, monatomic) is in the intial state P (see Fig.) on...
Text Solution
|
- A partition divides a container having insulated walls into two compar...
Text Solution
|
- An ideal gas is taken from the state A (pressure p, volume V) to the s...
Text Solution
|