A
B
C
D
Text Solution
Verified by Experts
The correct Answer is:


Similar Questions
Explore conceptually related problems
Recommended Questions
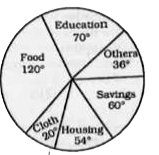
- Directions : The pie-chart given below shows expenditure incurred by a...
Text Solution
|
- The pie chart, given here shows monthly expenses on various heads and ...
Text Solution
|
- Directions : The pie-chart given below shows expenditure incurred by a...
Text Solution
|
- Directions : The pie-chart given below shows expenditure incurred by a...
Text Solution
|
- Directions : The pie-chart given below shows expenditure incurred by a...
Text Solution
|
- Instructions: The attached pie chart shows the expenditure and its sav...
Text Solution
|
- The pie chart given below shows the expenditure on various items and s...
Text Solution
|
- The pie-chart given here shows expenditures incurred by a family on va...
Text Solution
|
- Directions : The pie-chart given below shows expenditure incurred by a...
Text Solution
|