


Topper's Solved these Questions
STATISTICS
OSWAAL PUBLICATION|Exercise TEXTBOOK CORNER (EXERCISE 13.4)|3 VideosSTATISTICS
OSWAAL PUBLICATION|Exercise TEXTBOOK CORNER (EXERCISE 13.2 )|6 VideosSSLC KARNATAKA TOPPERS' ANSWERS MARCH 2018 Class-X
OSWAAL PUBLICATION|Exercise SECTION-E |4 VideosSURFACE AREA AND VOLUMES
OSWAAL PUBLICATION|Exercise EXERCISE 15.5|5 Videos
Similar Questions
Explore conceptually related problems
OSWAAL PUBLICATION-STATISTICS-TEXTBOOK CORNER (EXERCISE 13.3 )
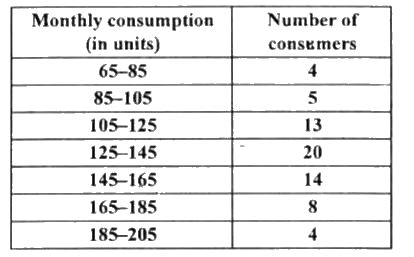
- The following frequency distribution gives the monthly consumption of ...
Text Solution
|
- If the median of the distribution given below is 28.5, find the values...
Text Solution
|
- A life insurance agent found the following data for distribution of ag...
Text Solution
|
- The length of 40 leaves of a plant is measured correct to the nearest ...
Text Solution
|
- The following table gives the distribution of the life time of 400 neo...
Text Solution
|
- 100 surnames were randomly picked up from a local telephone directory ...
Text Solution
|
- The distribution below gives the weights of 30 students of a class. Fi...
Text Solution
|