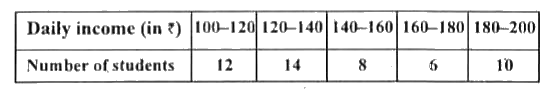
The following distribution gives the daily income of 50 workers of a factory. Convert the distribution above to a less than type cumulative frequency distribution, and draw its ogive.
The following distribution gives the daily income of 50 workers ofa factory: Convert the distribution to a less than type' cumulative frequency distribution and draw its ogive. Hence obtain the median of daily income.
Convert the following distribution to more than type, cumulative frequency distribution :
Given below is a frequency distribution table showing daily income of 100 workers of a factory : Convert this table to a cumulative frequency distribution table of 'more than type'.
The distribution of monthly wages of 200 workers of a certain factory is as given below Change the above distribution to a 'more than type' distribution and draw its ogive.
Find the mean from the following cumulative frequency distribution.
Find x and y from the following cumulative frequency distribution:
The following distribution gives the distribution of life times of washing machines of a certain company: Convert the above distribution into 'less than type' and draw its ogive.
The following table gives the information of daily income of 50 workers of a factory. Draw a 'less than type ogive' for the given data:
By changing the following frequency distribution to less than type distribution. Draw its ogive.
The following are the ages of 200 patients geting medical treatment in a hospital on a paticular day: Write the above distribution as "less than type' cumulative frequency distribution and also draw an ogive to find the median.