Home
Class 11
PHYSICS
Figure gives a speed - time graph of a p...

Figure gives a speed - time graph of a particle in motion along a constant direction. Three equal intervals of time are shown. In which interval is the average acceleration greatest in magnitude ? In which interval is the average speed greatest? Choosing the positive direction as the constant direction of motion give the signs of vand a in the three intervals. What are the acclerations at the points A, B, C and D?

Text Solution

Verified by Experts

(i) Average acceleration `= ("change in speed")/("time")`
Now for smaller intervals of time `v to t` graph, slope gives average acceleration. In second part, the slope is maximum. Hence acceleration is maximum (more than part 1 and part 3).
(ii) The average speed is maximum in `3^(rd)` part but a is zer` a =0 , v gt 0`
(iii) In first part, slope is positive, Hence, a and v both are positive `a gt 0 , v gt 0`
(iv) In second part the slope is negative, hence a is negative and speed is positive `a lt 0, v gt 0.`
(v) Speed is positive and a is zero in third part of graph.
(vi) Acceleration will be zero at points A,B,C, D in graph.
Promotional Banner

Topper's Solved these Questions

  • MOTION IN A STRAIGHT LINE

    KUMAR PRAKASHAN|Exercise SECTION-C|43 Videos
  • MOTION IN A STRAIGHT LINE

    KUMAR PRAKASHAN|Exercise SECTION-D|26 Videos
  • MOTION IN A STRAIGHT LINE

    KUMAR PRAKASHAN|Exercise SECTION-A TRY YOUR SELF (VSQs)|52 Videos
  • MECHANICAL PROPERTIES OF FLUIDS

    KUMAR PRAKASHAN|Exercise QUESTION PAPER (SECTION -C)|3 Videos
  • OBJECTIVE QUESTIONS AS PER NEW PAPER STYLE

    KUMAR PRAKASHAN|Exercise CHAPTER - 8 (Match Type questions)|5 Videos

Similar Questions

Explore conceptually related problems

Figure gives the x-t plot of a particle in one dimensional motion. Three different equal intervals of time are shown. In which interval is the average speed greatest and in which is it the least ? Give the sign of average velocity for each interval.

Fig. 2 (NCT).9 show the x-t plot of a particle in one dimensional motion. Three different equal intervals of time are shown. In which interval the average speed is greatest and in which it is the least ? Give th sign of average speed for each interval. .

Acceleration time graph of a particle moving along a straight line is given. Then average acceleration between t=0 & t=4 is :-

The speed-time graph of a particle moving along a fixed direction is shown in figure. Obtain the distance traversed by the particle between (a) t =0 s to 10s. (b) t = 2 s to 6s. What is the average speed of the particle over the intervals in (a) and (b) ?

The circular motion of a particle with constant speed is……….

The displacement of an object in a given time interval may be zero.

A car runs at constant speed around the horizontal race track shown in the figure. Over which portion of the track is the magnitude of the acceleration the greatest?

If decrease in velocity is same in equal interval of time, then draw x to t graph.

The magnitude of average velocity is equal to the average speed when a particle moves:-

The average value of alternating current I=I_(0) sin omegat in time interval [0, pi/omega] is

KUMAR PRAKASHAN-MOTION IN A STRAIGHT LINE -SECTION-B
  1. Figure gives the x to t plot of a particle executing one-dimensional s...

    Text Solution

    |

  2. Figure gives the x-t plot of a particle in one dimensional motion. Thr...

    Text Solution

    |

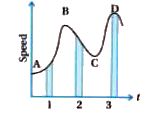
  3. Figure gives a speed - time graph of a particle in motion along a cons...

    Text Solution

    |

  4. A three wheeler starts from rest, accelerates uniformly with 1 ms-2 on...

    Text Solution

    |

  5. A boy standing on a stationary lift (open from above) throws a ball up...

    Text Solution

    |

  6. On a long horizontally moving belt (From figure) a child runs to and f...

    Text Solution

    |

  7. Two stones are thrown up simultaneously from the edge of a cliff 200 m...

    Text Solution

    |

  8. The speed-time graph of a particle moving along a fixed direction is s...

    Text Solution

    |

  9. The velocity - time graph of a particle in one dimensional motion is s...

    Text Solution

    |

  10. A vehicle travels different distances with different speeds in the sam...

    Text Solution

    |

  11. A person walking in a straight line, covers half of the distance to be...

    Text Solution

    |

  12. A motorcyclist covers 1/3 of a given distance with a speed of 10 kmh ^...

    Text Solution

    |

  13. The distance between two stations is 40 km. A train takes 1 hour to tr...

    Text Solution

    |

  14. A ball thrown in vertically upward direction attains maximum height of...

    Text Solution

    |

  15. The position of an object, moving in one dimension, is given by the fo...

    Text Solution

    |

  16. The position of a particle moving along a straight line is given by x ...

    Text Solution

    |

  17. For a moving paritcle, the relation between time and position is given...

    Text Solution

    |

  18. Two cars A and B are at positions 100 m and 200 m from the origin at t...

    Text Solution

    |

  19. The distance between Ahmedabad and Vadodara is 100 km. Two trains set-...

    Text Solution

    |

  20. A driver of train A, moving at a speed 30 ms^(-1), sights another trai...

    Text Solution

    |