A
B
C
D
Text Solution
Verified by Experts
The correct Answer is:


Topper's Solved these Questions
SOLUTIONS
AAKASH SERIES|Exercise Objective Exercise -2|110 VideosSOLUTIONS
AAKASH SERIES|Exercise Objective Exercise -3 (PREVIOUS NEEET/AIPMT )|24 VideosSOLUTIONS
AAKASH SERIES|Exercise Subjective Exercise-3 (Problems)|7 VideosSOLIDS STATE
AAKASH SERIES|Exercise PRACTICE EXERCISE|63 VideosSTATES OF MATTER
AAKASH SERIES|Exercise ADDITIONAL PRACTICE EXERCISE -PRACTICE SHEET (ADVANCED) (LINKED COMPREHENSION TYPE QUESTIONS) (PASSAGE- IV)|2 Videos
Similar Questions
Explore conceptually related problems
AAKASH SERIES-SOLUTIONS -Objective Exercise -1
- Which one of the following is not correct ?
Text Solution
|
- Which of the following statements are correct (a) the boiling point ...
Text Solution
|
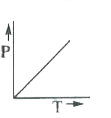
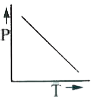
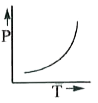
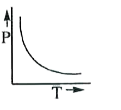
- The graph obtained by taking vapour pressure (P) of a liquid on y-axis...
Text Solution
|
- Which graph of the following represents the graph between log p (on Y ...
Text Solution
|
- Which of the following solutions will have the lowest vapour pressure
Text Solution
|
- 6 g of urea is dissolved in 90g of boiling water. The vapour pressure ...
Text Solution
|
- At a given temperature (a) Vapour pressure of a solution containing ...
Text Solution
|
- As temperature increases, vapour pressure of a liquid
Text Solution
|
- Statement-1: Acetone + Carbon disulphide solution shows positive devia...
Text Solution
|
- Which one of the following is correct for solutions of components of A...
Text Solution
|
- When mercuric iodide is added to the aqueous solution of potassium iod...
Text Solution
|
- The degree of dissociation (alpha) of a weak electrolyte Ax By is rela...
Text Solution
|
- Which of the following aqueous solution has the highest boiling point ...
Text Solution
|
- When mercuric iodide is added to the aqueous solution of potassium iod...
Text Solution
|
- In the depression of freezing point experiment, it is found that (a...
Text Solution
|
- During the depression in freezing point experiment, an equilibrium is ...
Text Solution
|
- The molal elevation constant is the ratio of the elevation in boliing ...
Text Solution
|
- The relationship between osmotic pressure at 273 K when 10 g glucose (...
Text Solution
|
- Equimolar solutions of electrolytes with different number of ion in th...
Text Solution
|
- If alpha is the degree of dissociation of Na2SO4, the Vant Hoff factor...
Text Solution
|