A
B
C
D
Text Solution
Verified by Experts
The correct Answer is:


Topper's Solved these Questions
THERMAL PROPERTIES OF MATTER
KUMAR PRAKASHAN|Exercise Section - D NCERT Exemplar Solution (Multiple Choice Questions MCQs) More than one options|1 VideosTHERMAL PROPERTIES OF MATTER
KUMAR PRAKASHAN|Exercise Section - D NCERT Exemplar Solution (Very Short Answer Type Questions )|5 VideosTHERMAL PROPERTIES OF MATTER
KUMAR PRAKASHAN|Exercise Section - C Objective Questions (VSQs) Assertion and Reason Type Questions|5 VideosSYSTEMS OF PARTICLES AND ROTATIONAL MOTION
KUMAR PRAKASHAN|Exercise SECTION-F (SECTION-D) QUESTIONS PAPER|1 VideosTHERMODYANMICS
KUMAR PRAKASHAN|Exercise Question Paper|11 Videos
Similar Questions
Explore conceptually related problems
KUMAR PRAKASHAN-THERMAL PROPERTIES OF MATTER-Section - D NCERT Exemplar Solution (Multiple Choice Questions MCQs)
- A bimetallic strip is made of aluminium and steel (alpha(Al)gtalpha("s...
Text Solution
|
- A uniform metallic rod rotates about its perpendicular bisector with c...
Text Solution
|
- The graph between two temperature scales A and B is shown in figure. B...
Text Solution
|
- An aluminium sphere is dipped into water which of the following is tru...
Text Solution
|
- As the temperature is increased, the time period of a pendulum
Text Solution
|
- With what heat is associated ?
Text Solution
|
- The radius of a metal sphere at room temperature T is R, and the coeff...
Text Solution
|
- A sphere , a cube and a thin circular plate, all of same material and ...
Text Solution
|
- 'Gulab Jamuns' (assumed to be spherical) are to be heated in an oven. ...
Text Solution
|
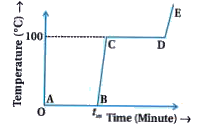
- Refer to the plot of temperature versus time figure showing the change...
Text Solution
|
- A glass full of hot milk is poured on the table. It begins to cool gra...
Text Solution
|