Home
Class 9
PHYSICS
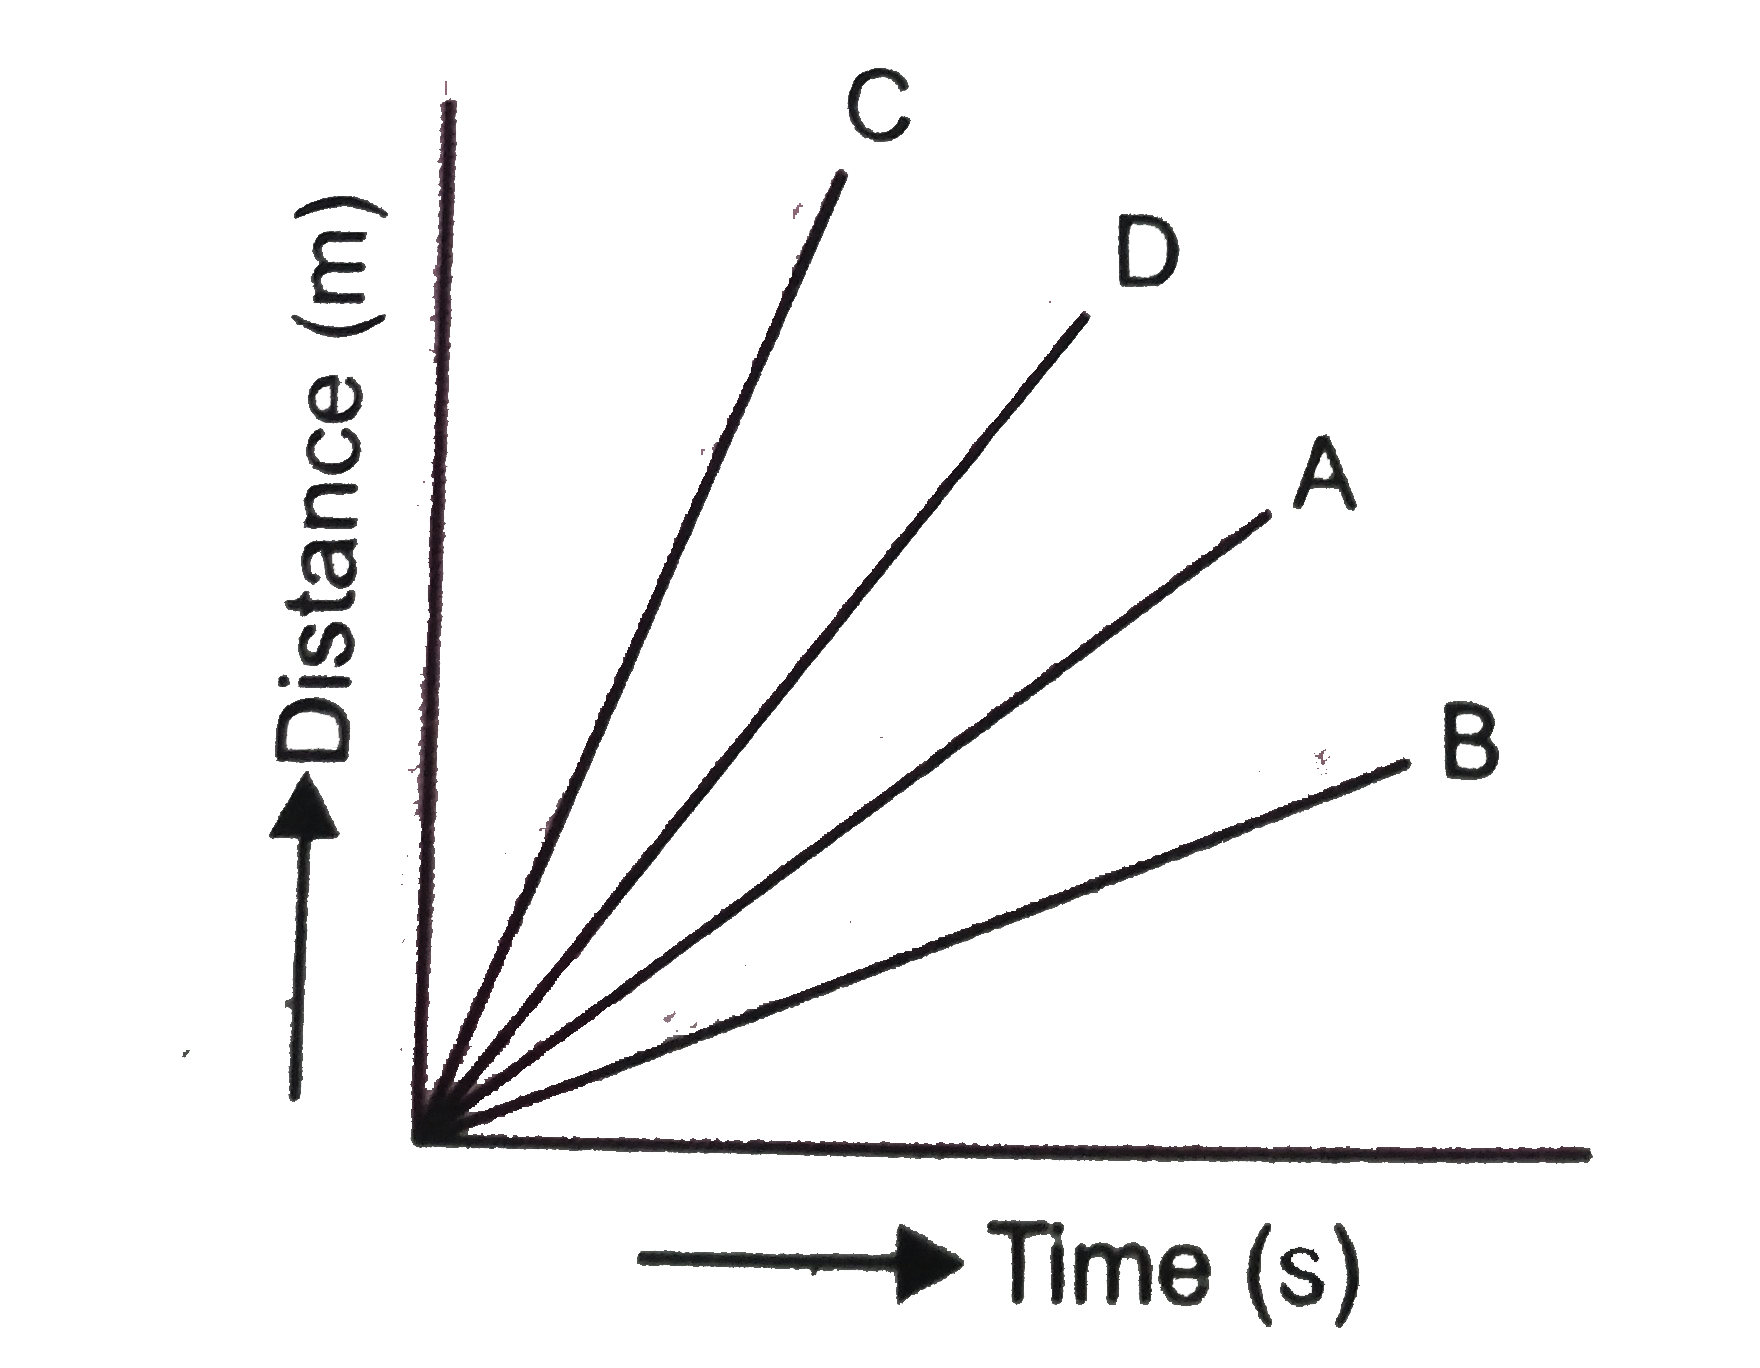
Four cars A, B and C are moving on a lev...

Four cars `A, B` and `C` are moving on a levelled road. Their distance versus time graphs are shown in Fig. Choose the correct statement

A

Car A is faster than car D

B

Car B is the slowest

C

Car D is faster than car C

D

Car C is the slowest

Text Solution

Verified by Experts

The slope of distance-time graph represents the speed. From the graph, it is clear that the solpe of distance-time graph for car B is less than all other cars. So, the slope is minimum for car B. Hence, car B is the slowest.
Promotional Banner

Topper's Solved these Questions

  • MOTION

    NCERT EXEMPLAR ENGLISH|Exercise Short Answer Type Questions|7 Videos
  • MOTION

    NCERT EXEMPLAR ENGLISH|Exercise Long Answer Type Questions|6 Videos
  • GRAVITATION

    NCERT EXEMPLAR ENGLISH|Exercise LONG ANSWER TYPE QUESTIONS|4 Videos
  • SOUND

    NCERT EXEMPLAR ENGLISH|Exercise Long Answer Type Questions|3 Videos

Similar Questions

Explore conceptually related problems

Consider the following graphs Choose the correct statements

Force acting on a block versus time graph is as shown in figure Choose the correct options. (g = 10 m//s^(-2))

A graph of x versus t is shown in figure. Choose correct alternative from below.

The velocity - time graph of two bodies A and B is shown in figure. Choose correct statement.

Two particles A and B are moving along x-axis. Their x-coordinate versus time graphs are as shown below (a) Find the time when the particles start their journey and the x-coordinate at that time. (b) Find velocities of the two particles. (c) When and where the particles strike with each other.

Displacement versus time curve for a particle executing SHM is shown in figure. Choose the correct statements.

Displacement versus time curve for a particle executing SHM is shown in figure. Choose the correct statements.

Pressure versus temperature graphs of an ideal gas are as shown in figure. Choose the wrong statement

Pressure versus temperature graphs of an ideal gas are as shown in figure. Choose the wrong statement

Car A and car B move on a straight road and their velocity versus time graph are as shown in figure. Comparing the motion or car A in between t=0 to t =8 sec . And motion of car B in between t=0 to t=7 sec ., pick up the correct statement. .