Home
Class 11
CHEMISTRY
Match the graphs between the following v...

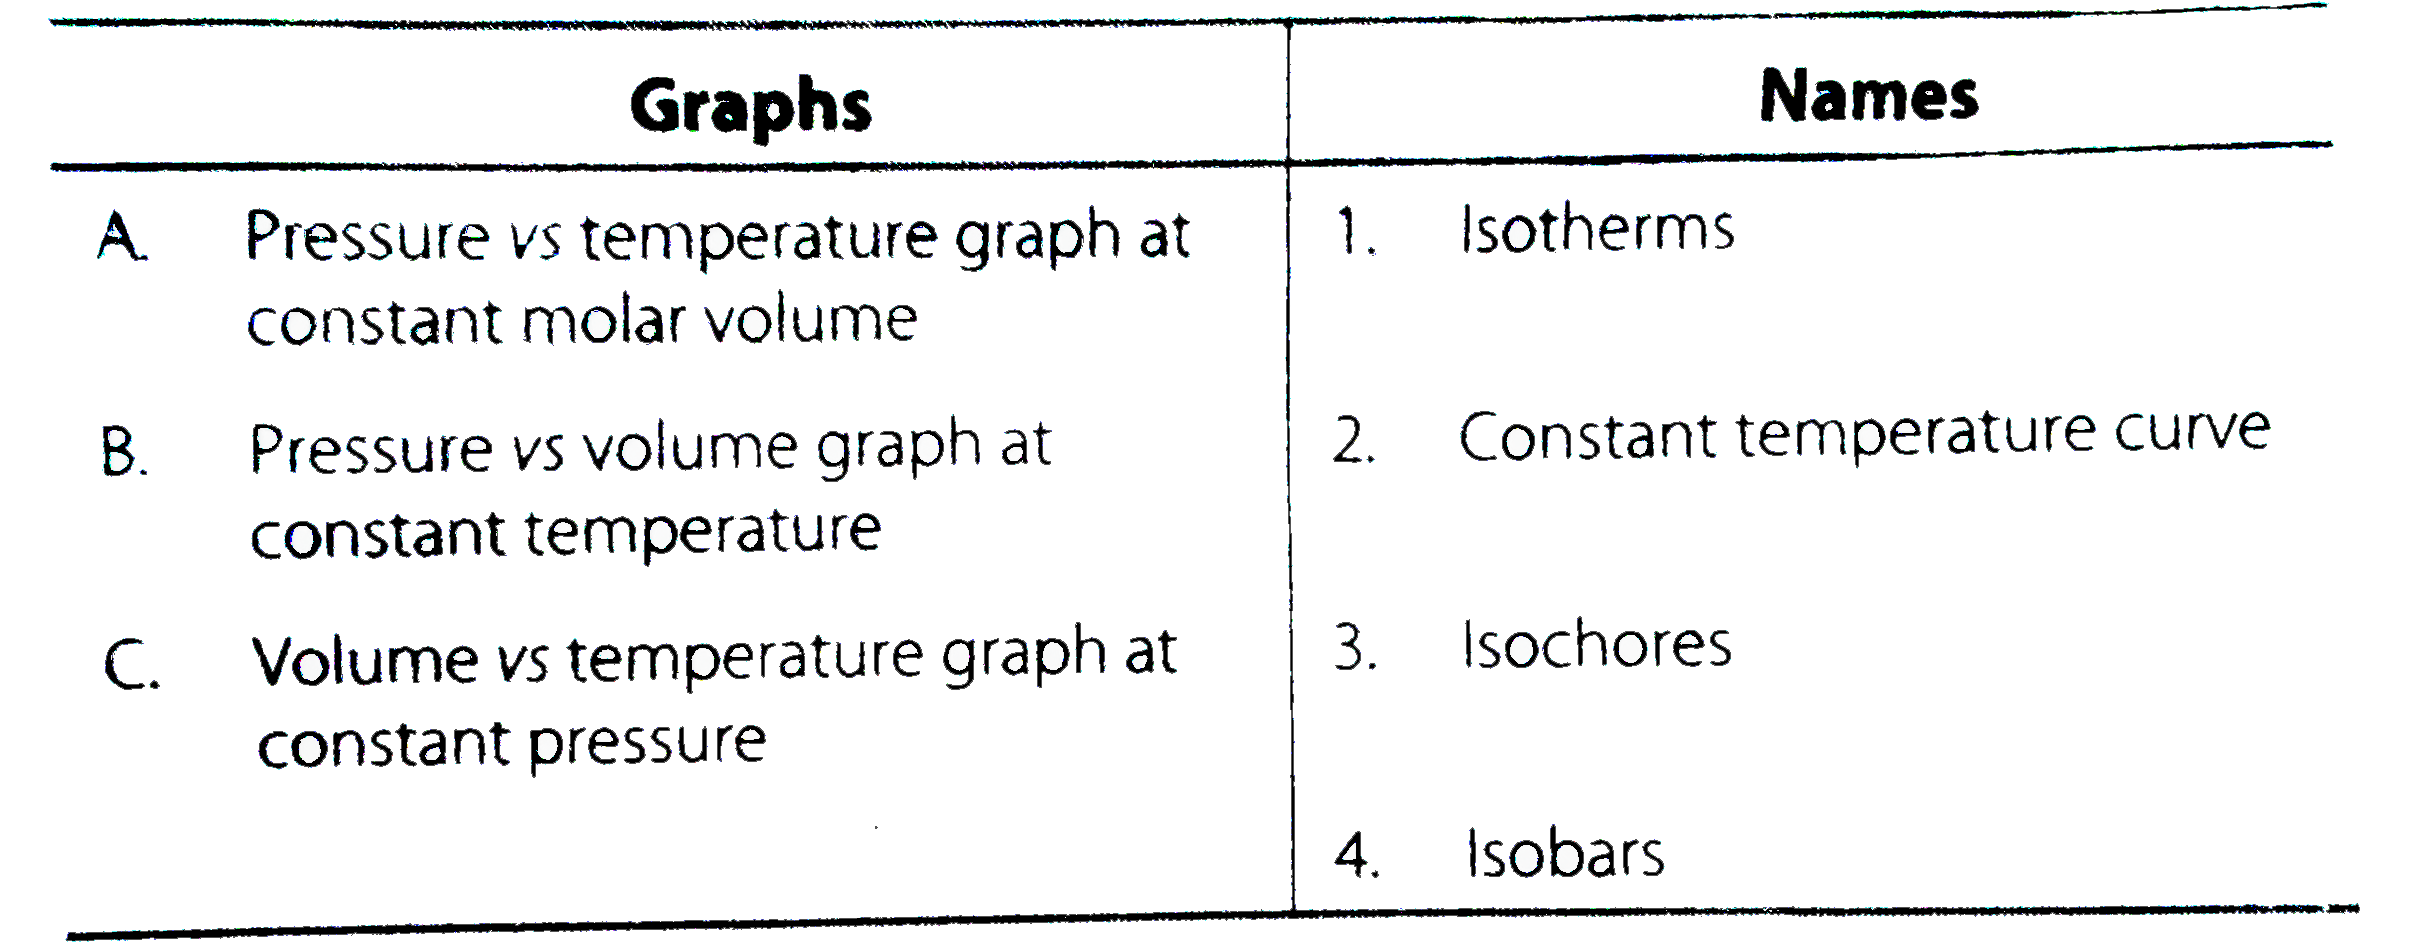
Match the graphs between the following variables with their names.

Text Solution

Verified by Experts

The correct Answer is:
`A. rarr (3) B. rarr (1) C. rarr (4)`

A. when molar volume is constant, the `p-T` graph is called isochore.
B. When temperature is constant, the `p-V` graph is called isotherm.
C. When pressure is constant, `V-T` graph is called isobar.
Doubtnut Promotions Banner Mobile Dark
|

Topper's Solved these Questions

  • STATES OF MATTER

    NCERT EXEMPLAR ENGLISH|Exercise Assertion and Reason|6 Videos
  • STATES OF MATTER

    NCERT EXEMPLAR ENGLISH|Exercise Long Answer Type Question|6 Videos
  • STATES OF MATTER

    NCERT EXEMPLAR ENGLISH|Exercise Short Answer Type Question|23 Videos
  • SOME BASIC CONCEPTS OF CHEMISTRY

    NCERT EXEMPLAR ENGLISH|Exercise All Questions|45 Videos
  • STRUCTURE OF ATOM

    NCERT EXEMPLAR ENGLISH|Exercise All Questions|55 Videos

Similar Questions

Explore conceptually related problems
Match the following with their name

Match the entries between the following two columns.

Match the following compound with their IUPAC name :

Match the following graphs of ideal gas with their coordinates.

Match between the following representing parts of the sperms and their functions and choose the correct option.

The following graph gives the minimum and maximum temperatures of various cities on a specific day. Read the graph and answer the following questions Name the city which has the minimum difference between its minimum and maximum temperatures.

A graph between vapour pressure and temperature of few liquids is given below . Study the graph and answer the following : Which of the following statements is true ?

Name the type of joint between the following: Atlas/axis

Name the type of joint between the following: Between phalanges

Name the type of joint between the following: Between pubic bones in the pelvic girdle