Home
Class 9
MATHS
Prepare a continuous grouped frequency d...

Prepare a continuous grouped frequency distribution from the following data

Also, find the size of class intervals.

Text Solution

Verified by Experts

Here, we see that the difference between two mid-points is 15-5 i.e., 10.
It means the width of the class interval is 10.
Let the lower limit of the first class interval be a.
Then, its upper limit =a+10
Now, mid value of the first class interval =5
`rArr "Mid value"=("Lower limit"+"Upper limit")/(2)`
`rArr 5=(a+a+10)/(2) rArr 2a+10=10`
`rArr 2a=0 rArr a=0`
So, the first class interval is 0-10.
Now, we prepare a continous grouped frequency distribution table is given below

Hence, the size of the class interval is 10 i.e., 10-0.
Promotional Banner

Topper's Solved these Questions

  • STATISTICS AND PROBABILITY

    NCERT EXEMPLAR ENGLISH|Exercise LONG ANSWER TYPE QUESTIONS|12 Videos
  • STATISTICS AND PROBABILITY

    NCERT EXEMPLAR ENGLISH|Exercise VERY SHORT ANSWER TYPES QUESTIONS|10 Videos
  • QUADRILATERALS

    NCERT EXEMPLAR ENGLISH|Exercise LONG ANSWER TYPE QUESTIONS|18 Videos
  • TRIANGLES

    NCERT EXEMPLAR ENGLISH|Exercise LONG ANSWER TYPE QUESTIONS|21 Videos

Similar Questions

Explore conceptually related problems

From the frequency distribution table from the following data

Draw a frequency polygon from the following data:

Draw a histogram and frequency polygon from the following data:

Contruct a cumulative frequency distributions table from the following frequency table:

Contruct a cumulative frequency distributions table from the following frequency table:

The following are weights (in kg) of 50 children taken at the time of birth: Make an inclusive form grouped frequency distribution table with 0.3 kg as the width of ' each class. Also, find the true class limits of each class.

For drawing a frequency polygon of a continuous frequency distribution, we plot the points whose ordinates are the frequencies of the respecitve classes and abscissae are, respectively

Construct a frequency distributions table from the following cumulatvive frequency table. {:( " Class interval " , ," Cumulative Frequency "),( 0-9 , , 15),(10-19, ,23),(20-29, ,38),(30-39,, 56),(40-49,,68),(50-59,,90 ):}

The distance (in km) of 40 engineers from their residence to their place of work were found as follows. Construct a grouped frequency distribution table with calss- size 5 for the data given above taking the first interval as 0-5 (5 not included).

A study was conducted to find out the concentration of sulphur dioxide in the air in parts per million (ppm) of a certain city. The data obtained for 30 days is a follows : (i) Make a grouped frequency distribution table for this data with class-intervals as 0.00-0.04, 0.04-0.08 and so on. (ii) For how many day's was the concentration of sulphar dioxide more than 0.11 parts per million (ppm)?

NCERT EXEMPLAR ENGLISH-STATISTICS AND PROBABILITY-SHORT ANSWER TYPE QUESTIONS
  1. The blood groups of 30 students are recorded as follows: A, B, O, A,...

    Text Solution

    |

  2. The value of pi upto 35 decimal places is given below 3.141592653589...

    Text Solution

    |

  3. The scores (out of 100) obtained by 33 students in a mathematics test ...

    Text Solution

    |

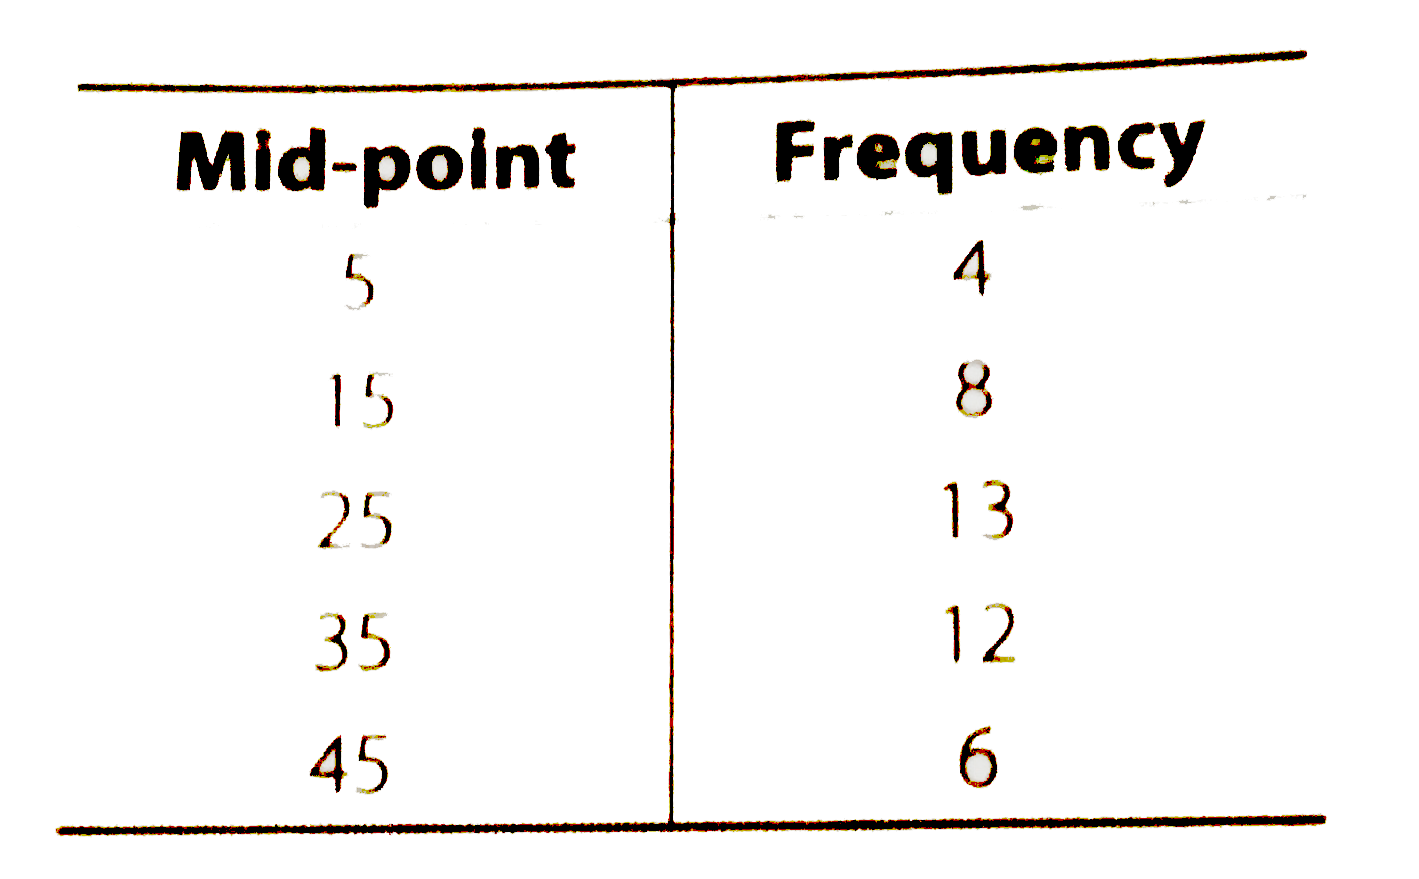
  4. Prepare a continuous grouped frequency distribution from the following...

    Text Solution

    |

  5. Convert the given frequency distribution into a continuouos grouped fr...

    Text Solution

    |

  6. The expenditure of a family of different heads in a month is given bel...

    Text Solution

    |

  7. Expenditure on education of a country during a five years period (2002...

    Text Solution

    |

  8. The following table gives the frequencies of most commonly used letter...

    Text Solution

    |

  9. If the mean of the following data is 20.2, then find the value of p.

    Text Solution

    |

  10. Obtain the mean of the following distribution.

    Text Solution

    |

  11. A class consists of 50 students out of which 30 are girls. The mean of...

    Text Solution

    |

  12. Mean of 50 observations was found to be 80.4. But later on, it was dis...

    Text Solution

    |

  13. Ten observations 6, 14, 15, 17, x+1, 2x-13, 30, 32, 34 and 43 are writ...

    Text Solution

    |

  14. The points scored by a basket ball team in a series of matches are as ...

    Text Solution

    |

  15. In the figure, there is histrogram depicting daily wages of workers in...

    Text Solution

    |

  16. A company selected 4000 households at random and surveyed them to find...

    Text Solution

    |

  17. Two dice are thrown simultaneouly 500 times. Each time the sum of the ...

    Text Solution

    |

  18. Bulbs are packed in cartons each containing 40 bulbs, seven hundred ca...

    Text Solution

    |

  19. Over the past 200 working days, the number of defective parts produced...

    Text Solution

    |

  20. A recent survey found that the edges ages of workers in a factory as f...

    Text Solution

    |