Text Solution
Verified by Experts


Topper's Solved these Questions
XII BOARDS
XII BOARD PREVIOUS YEAR PAPER ENGLISH|Exercise SET -I Section -A|8 VideosXII BOARDS
XII BOARD PREVIOUS YEAR PAPER ENGLISH|Exercise SET -I Section -B|11 VideosXII BOARDS
XII BOARD PREVIOUS YEAR PAPER ENGLISH|Exercise Section C|19 VideosSAMPLE PAPER 2019
XII BOARD PREVIOUS YEAR PAPER ENGLISH|Exercise Section E Part B|3 Videos
Similar Questions
Explore conceptually related problems
XII BOARD PREVIOUS YEAR PAPER ENGLISH-XII BOARDS-Section D
- Given below is the diagram of a human ovum surrounded by a few sperms....
Text Solution
|
- Study the schematic representation of the genes involved in the lac op...
Text Solution
|
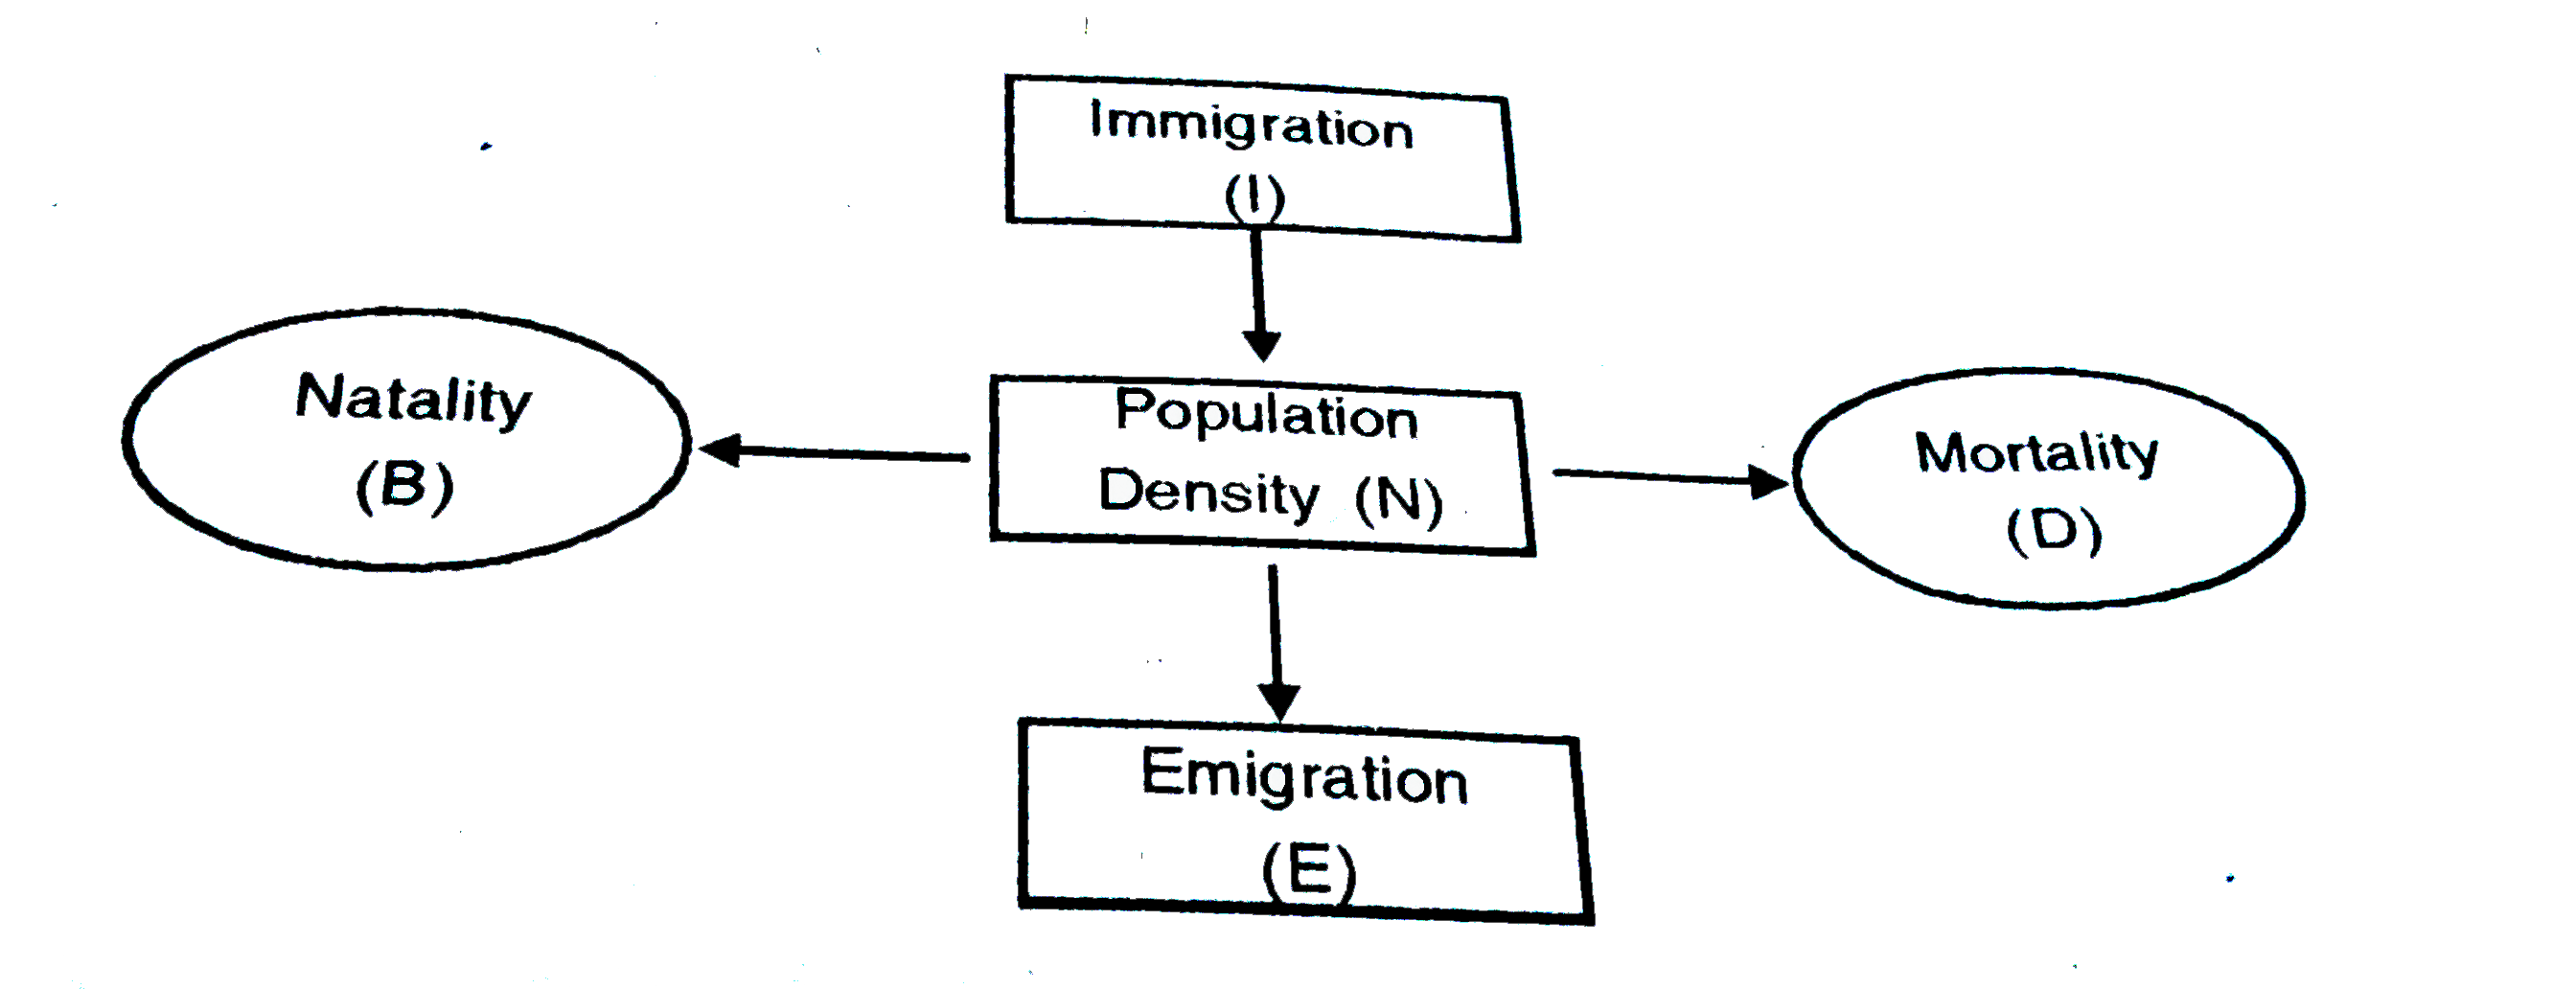
- (a) Study the flow chart given below and complete the equation that fo...
Text Solution
|
- Draw a diagrammatic sectional view of a human seminiferous tubule, and...
Text Solution
|
- Explain the mechanism of sex-determination in humans. b) Differentia...
Text Solution
|
- A person in your colony has recently been diagnosed with AIDS. People/...
Text Solution
|
- a) Write the specific features of the genetic code AUG. b) Genetic c...
Text Solution
|
- a) Differentiate between dominance and co-dominance. b) Explain co-d...
Text Solution
|
- How does the process of natural selection affect Hardy-Weinberg equili...
Text Solution
|
- Explain Mendel's law of independent assortment by taking a suitable ex...
Text Solution
|
- How did Morgan show the deviation in inheritance pattern in Drosophila...
Text Solution
|
- a) Why does endosperm development precede development in angiosperm s...
Text Solution
|
- Explain the ovarian and uterine events that occur during a menstrual c...
Text Solution
|