Text Solution
Verified by Experts


Topper's Solved these Questions
Similar Questions
Explore conceptually related problems
XII BOARD PREVIOUS YEAR PAPER ENGLISH-XII BOARDS-SECTION - A
- Two identical conducting balls A and B have charges- Q and + 3Q respec...
Text Solution
|
- A metal spherical shell has an inner radius R(1) and outer radius R(2...
Text Solution
|
- Under what condition will the current in a wire be the same when conne...
Text Solution
|
- The ozone layer on the top of the stratosphere is crucial for human su...
Text Solution
|
- Do electromagnetic waves carry energy and momentum?
Text Solution
|
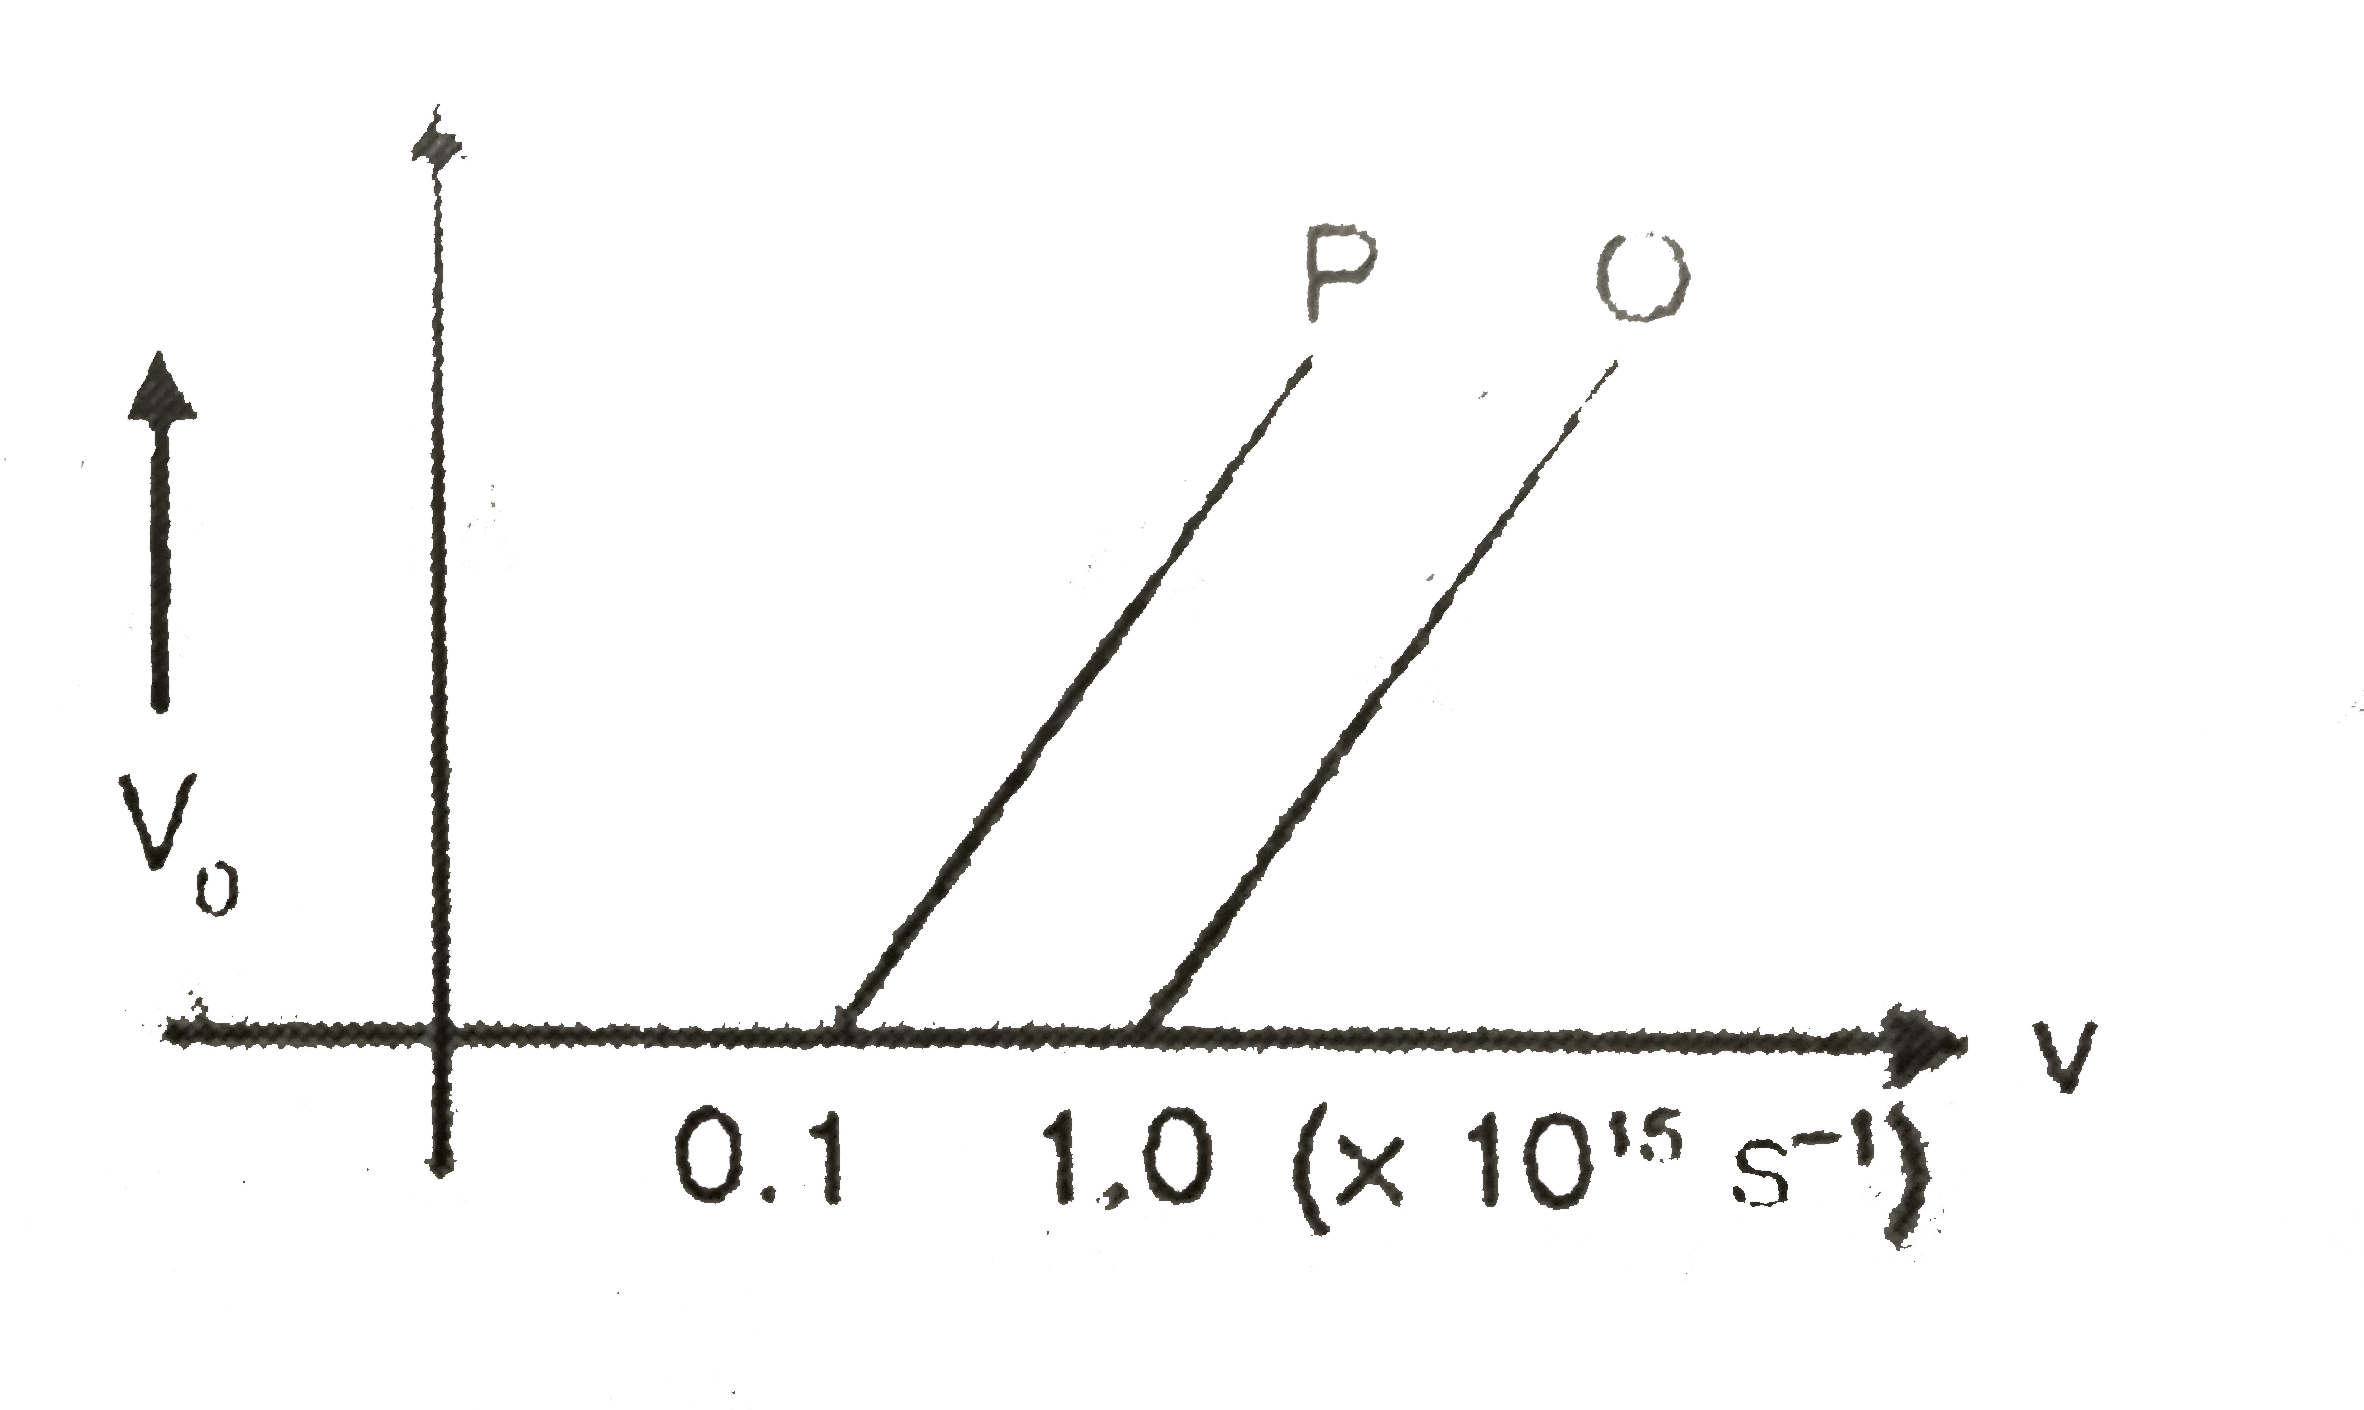
- The graph shows variation of stopping potential V(0) versus frequency ...
Text Solution
|
- Why is ground wave transmission of signals restricted to a frequency o...
Text Solution
|