A
B
C
D
Text Solution
Verified by Experts
The correct Answer is:


Topper's Solved these Questions
REST AND MOTION : KINEMATICS
HC VERMA ENGLISH|Exercise Objective -2|9 VideosREST AND MOTION : KINEMATICS
HC VERMA ENGLISH|Exercise Exercises|51 VideosREST AND MOTION : KINEMATICS
HC VERMA ENGLISH|Exercise worked out Examples|20 VideosPHYSICS AND MATHEMATICS
HC VERMA ENGLISH|Exercise Question for short Answer|14 VideosROTATIONAL MECHANICS
HC VERMA ENGLISH|Exercise Questions for short Answer|21 Videos
Similar Questions
Explore conceptually related problems
HC VERMA ENGLISH-REST AND MOTION : KINEMATICS-Objective -1
- A motor car is going due north at a speed of 50 km/h. It makes a 90^0 ...
Text Solution
|
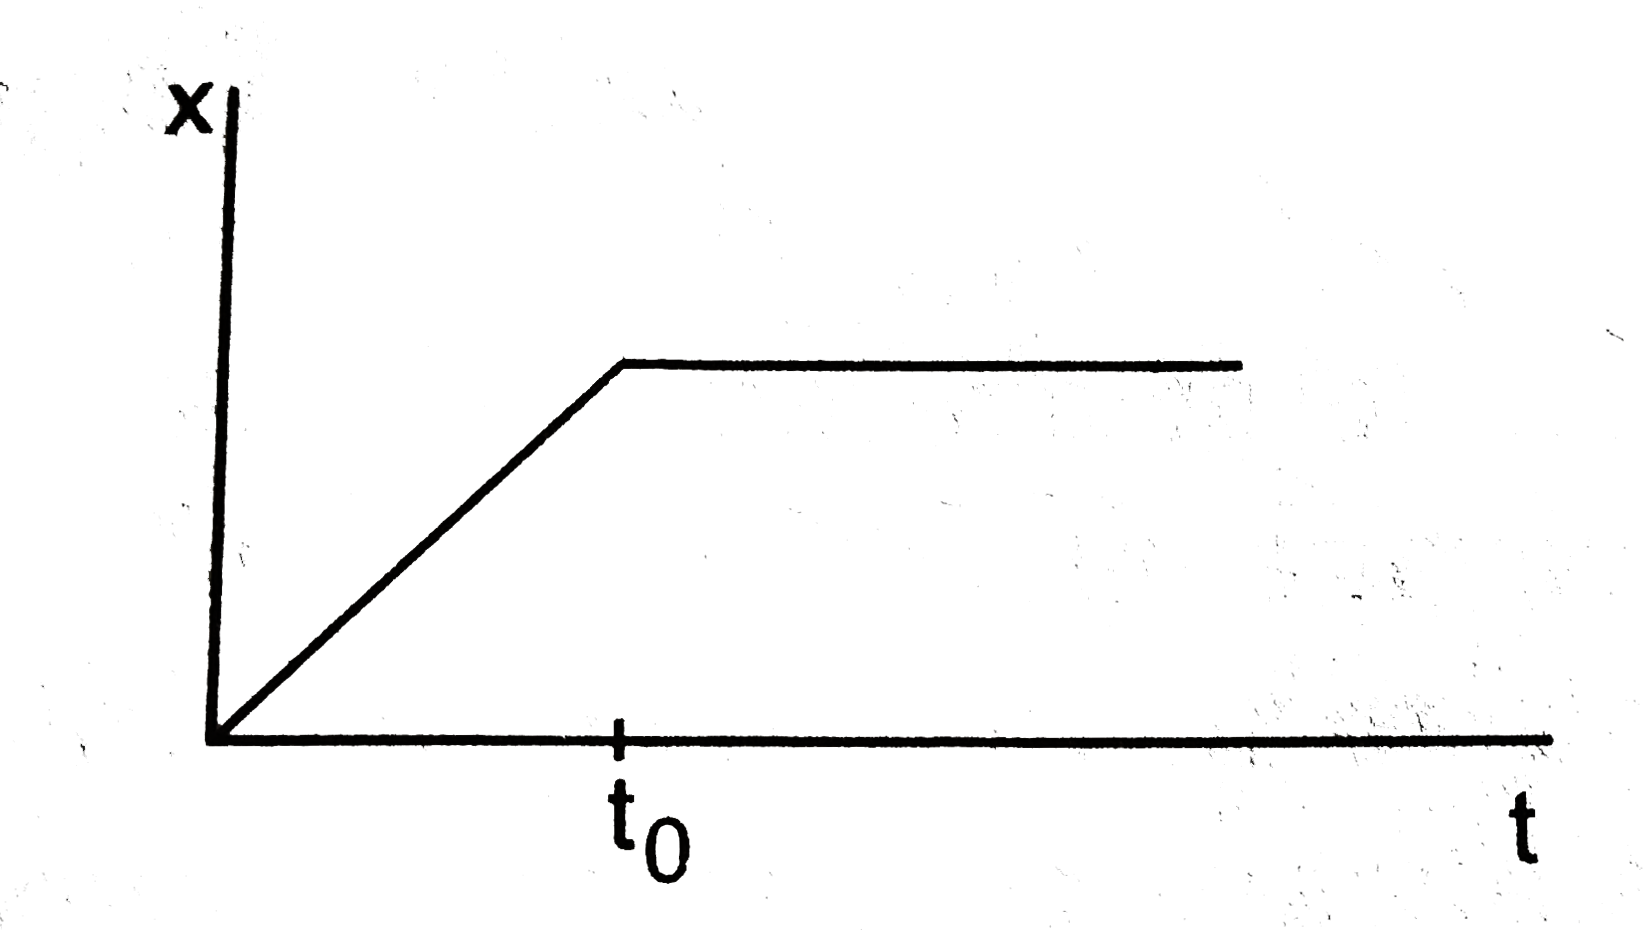
- Figure shows the displacement time graph of a particle moving on the X...
Text Solution
|
- A particle has a velocity u towards east at t=0. Its acceleration is t...
Text Solution
|
- A person travelling on a straight line moves with a uniform velocity v...
Text Solution
|
- A person travelling on a straight line moves with a uniform velocity v...
Text Solution
|
- A stone is released from an elevator going up with an acceleration a. ...
Text Solution
|
- A person standing near the edge of the top of a building throws two ba...
Text Solution
|
- In a projectile motion the velocity
Text Solution
|
- Two bullets are fired simultaneously, horizontally and with different ...
Text Solution
|
- The range of a projectile fired at an angle of 15^@ is 50 m. If it is ...
Text Solution
|
- Two projectiles A and B are projected with angle of projection 15^0 fo...
Text Solution
|
- A river is flowing from west to east at a speed of 5 metres per minute...
Text Solution
|
- In the arrangement shown in figure the ends P and Q of an inextensible...
Text Solution
|