A
B
C
D
Text Solution
Verified by Experts
The correct Answer is:


Topper's Solved these Questions
REST AND MOTION : KINEMATICS
HC VERMA ENGLISH|Exercise Exercises|51 VideosREST AND MOTION : KINEMATICS
HC VERMA ENGLISH|Exercise Question for short Answer|13 VideosREST AND MOTION : KINEMATICS
HC VERMA ENGLISH|Exercise Objective -1|13 VideosPHYSICS AND MATHEMATICS
HC VERMA ENGLISH|Exercise Question for short Answer|14 VideosROTATIONAL MECHANICS
HC VERMA ENGLISH|Exercise Questions for short Answer|21 Videos
Similar Questions
Explore conceptually related problems
HC VERMA ENGLISH-REST AND MOTION : KINEMATICS-Objective -2
- Consider the motion of the tip of the minute hand of a clock. In one h...
Text Solution
|
- A particle moves along the X-axis as x=u(t-2 s)+a(t-2 s)^2.
Text Solution
|
- Pick the correct statements:
Text Solution
|
- An object may have
Text Solution
|
- Mark the correct statements for a particle going on a straight line:
Text Solution
|
- The velocity of a particle is zero at t=0
Text Solution
|
- The velocity time plot for a particle moving on straight line is show...
Text Solution
|
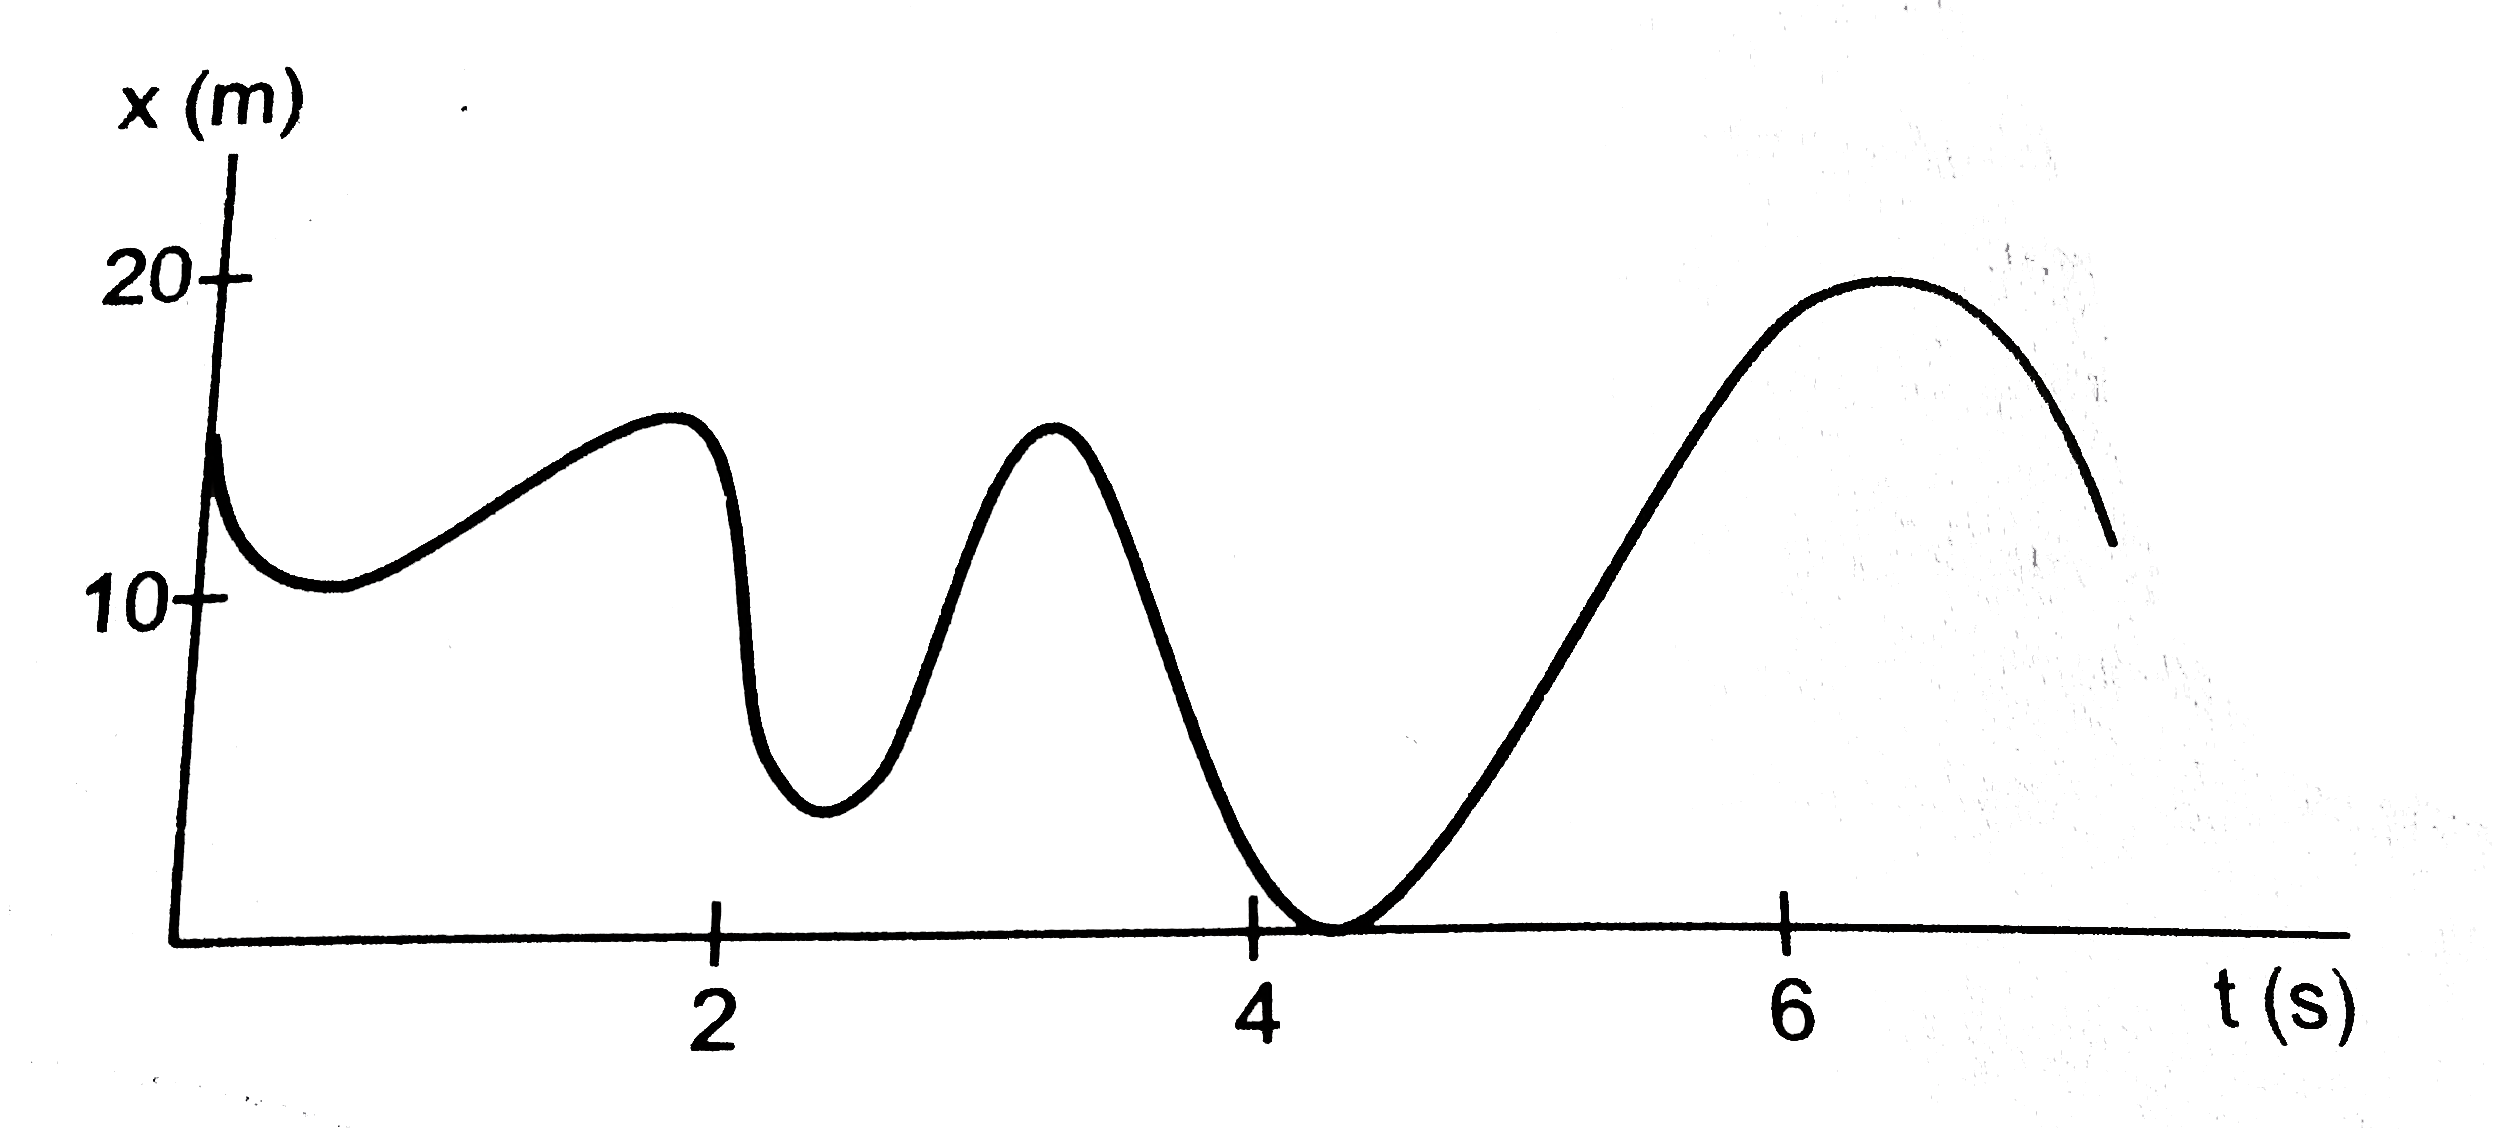
- Figure shows the position of a particle moving on the X-axis as a func...
Text Solution
|
- The accleration of a particle as seen from two frames S(1) and S(2) ha...
Text Solution
|