All the graphs below are intended to represent the same motion. One of them does it incorrectly. Pick it up.
A
B
C
D
Text Solution
AI Generated Solution
The correct Answer is:
To solve the problem of identifying which graph incorrectly represents the same motion, we will analyze each option step by step.
### Step-by-Step Solution:
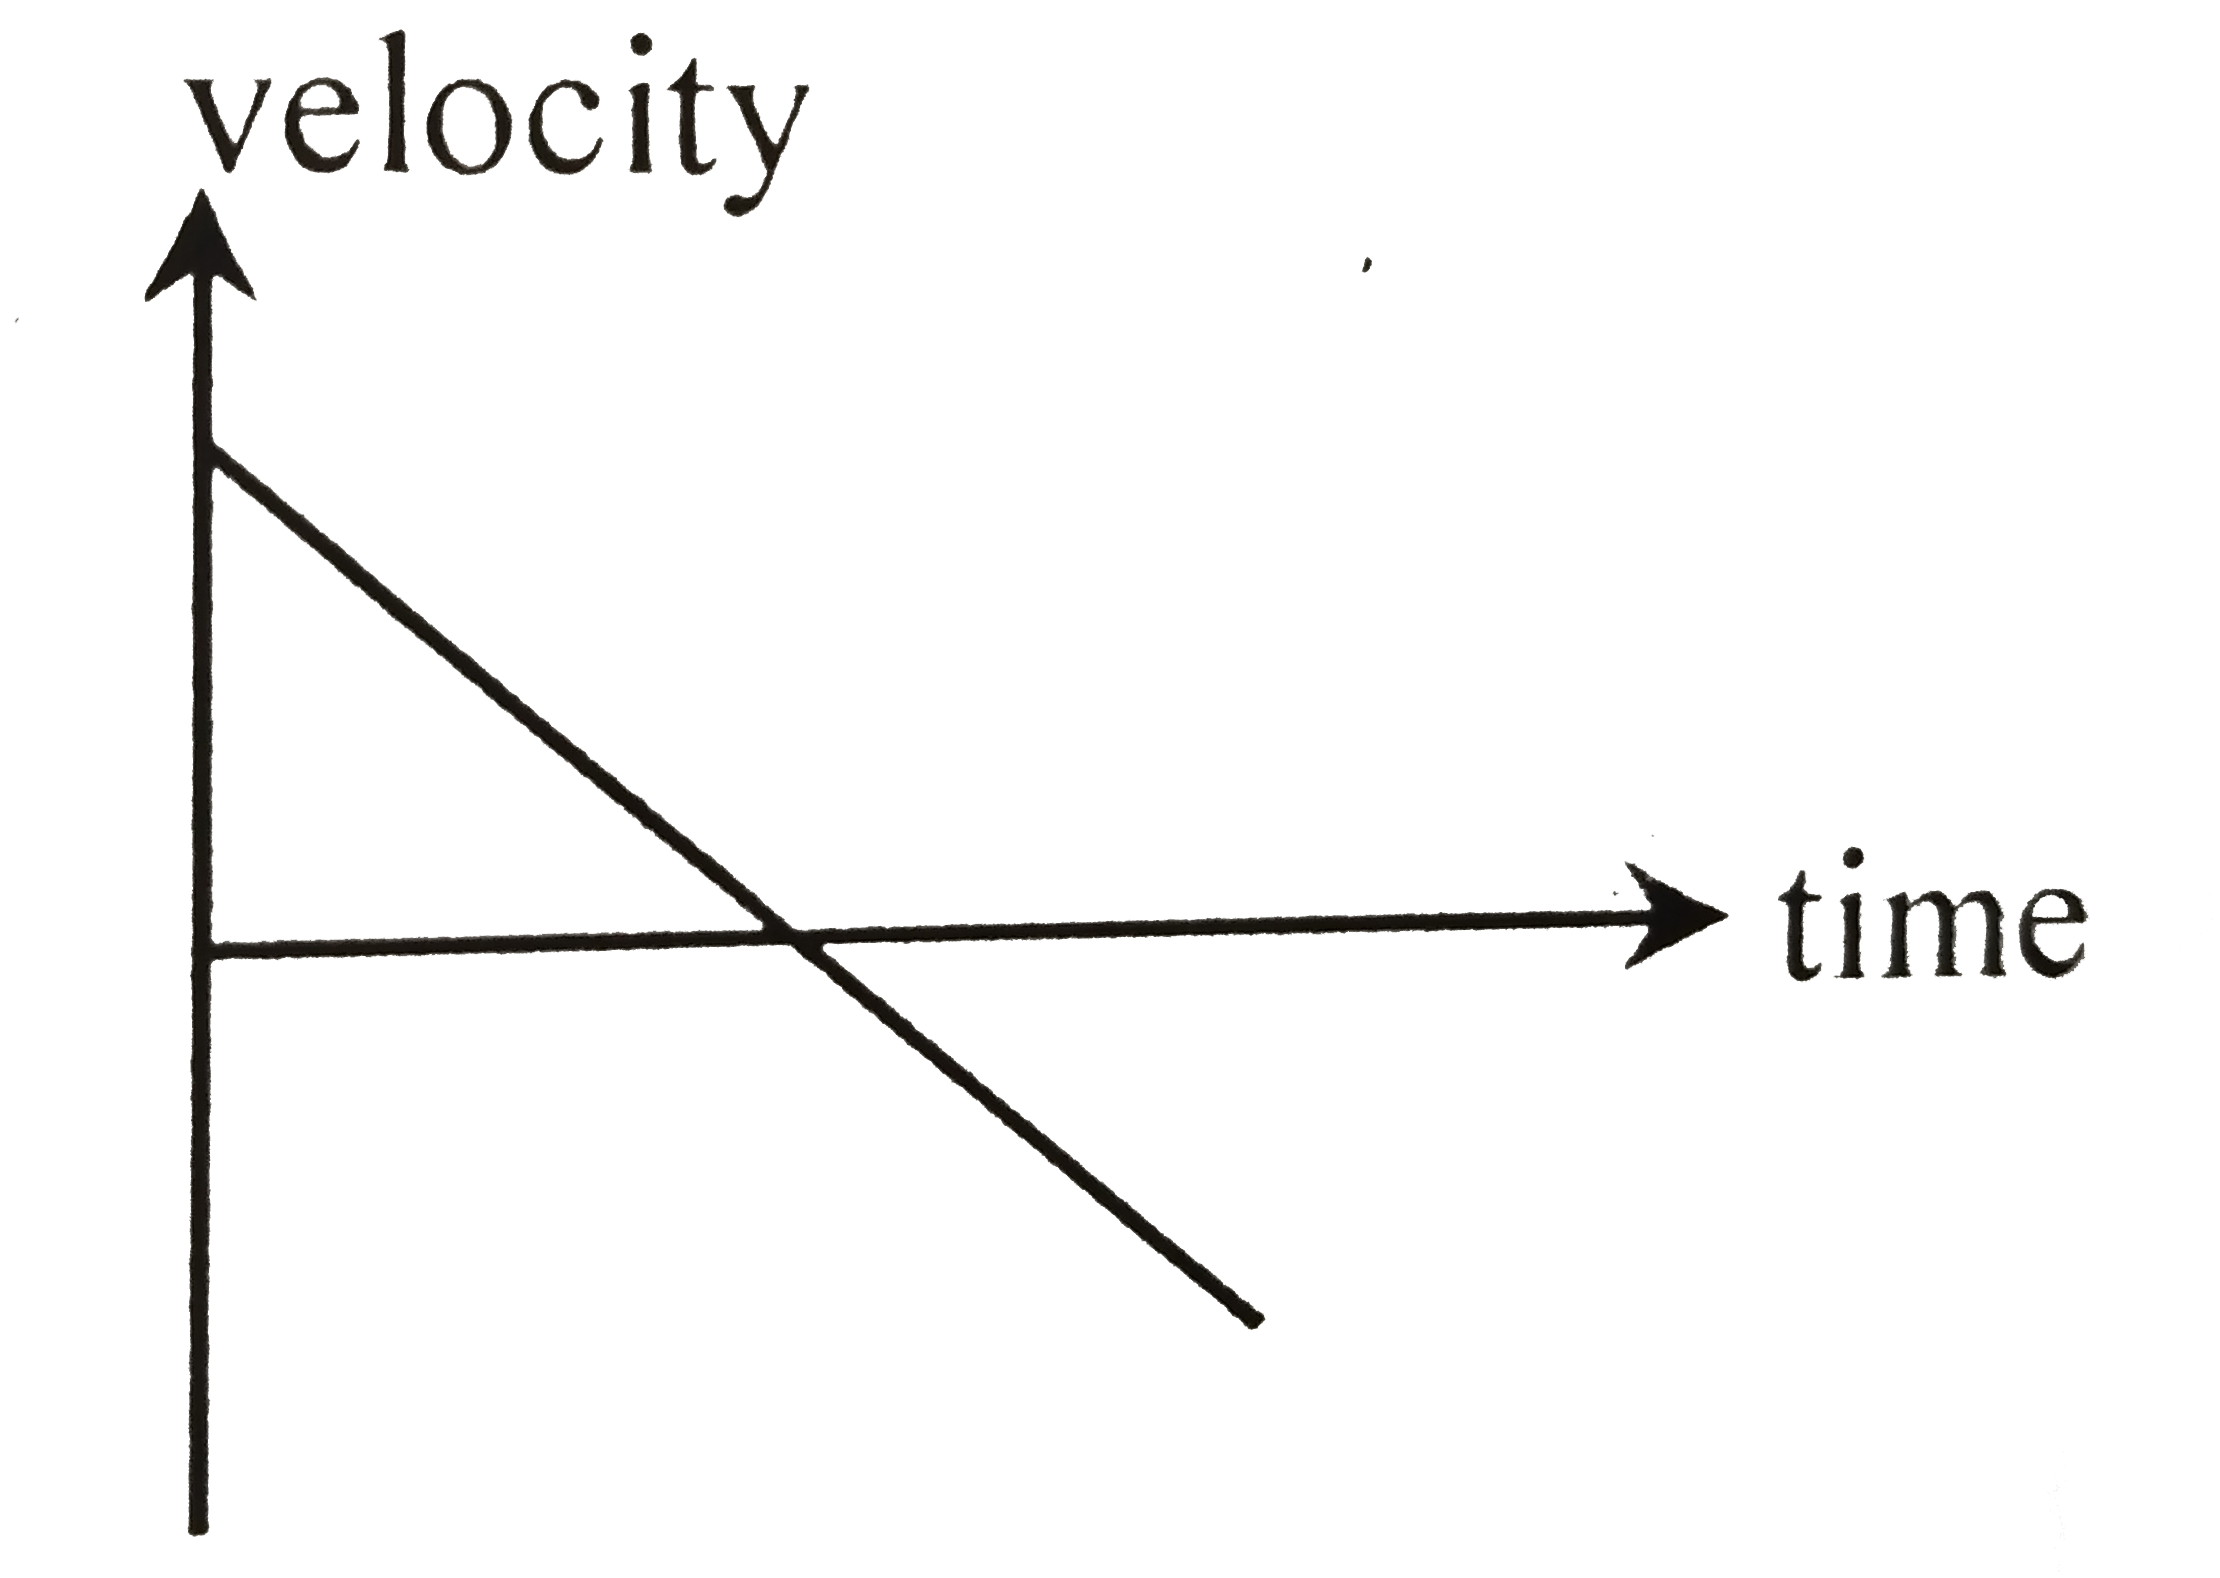
1. **Analyze Option 1:**
- The graph shows a negative slope, indicating that the velocity is decreasing.
- The initial velocity \( u \) is positive, and there is a negative acceleration.
- At some time \( t_0 \), the velocity becomes zero.
- **Conclusion:** This graph is consistent with a particle starting with positive velocity and experiencing negative acceleration.
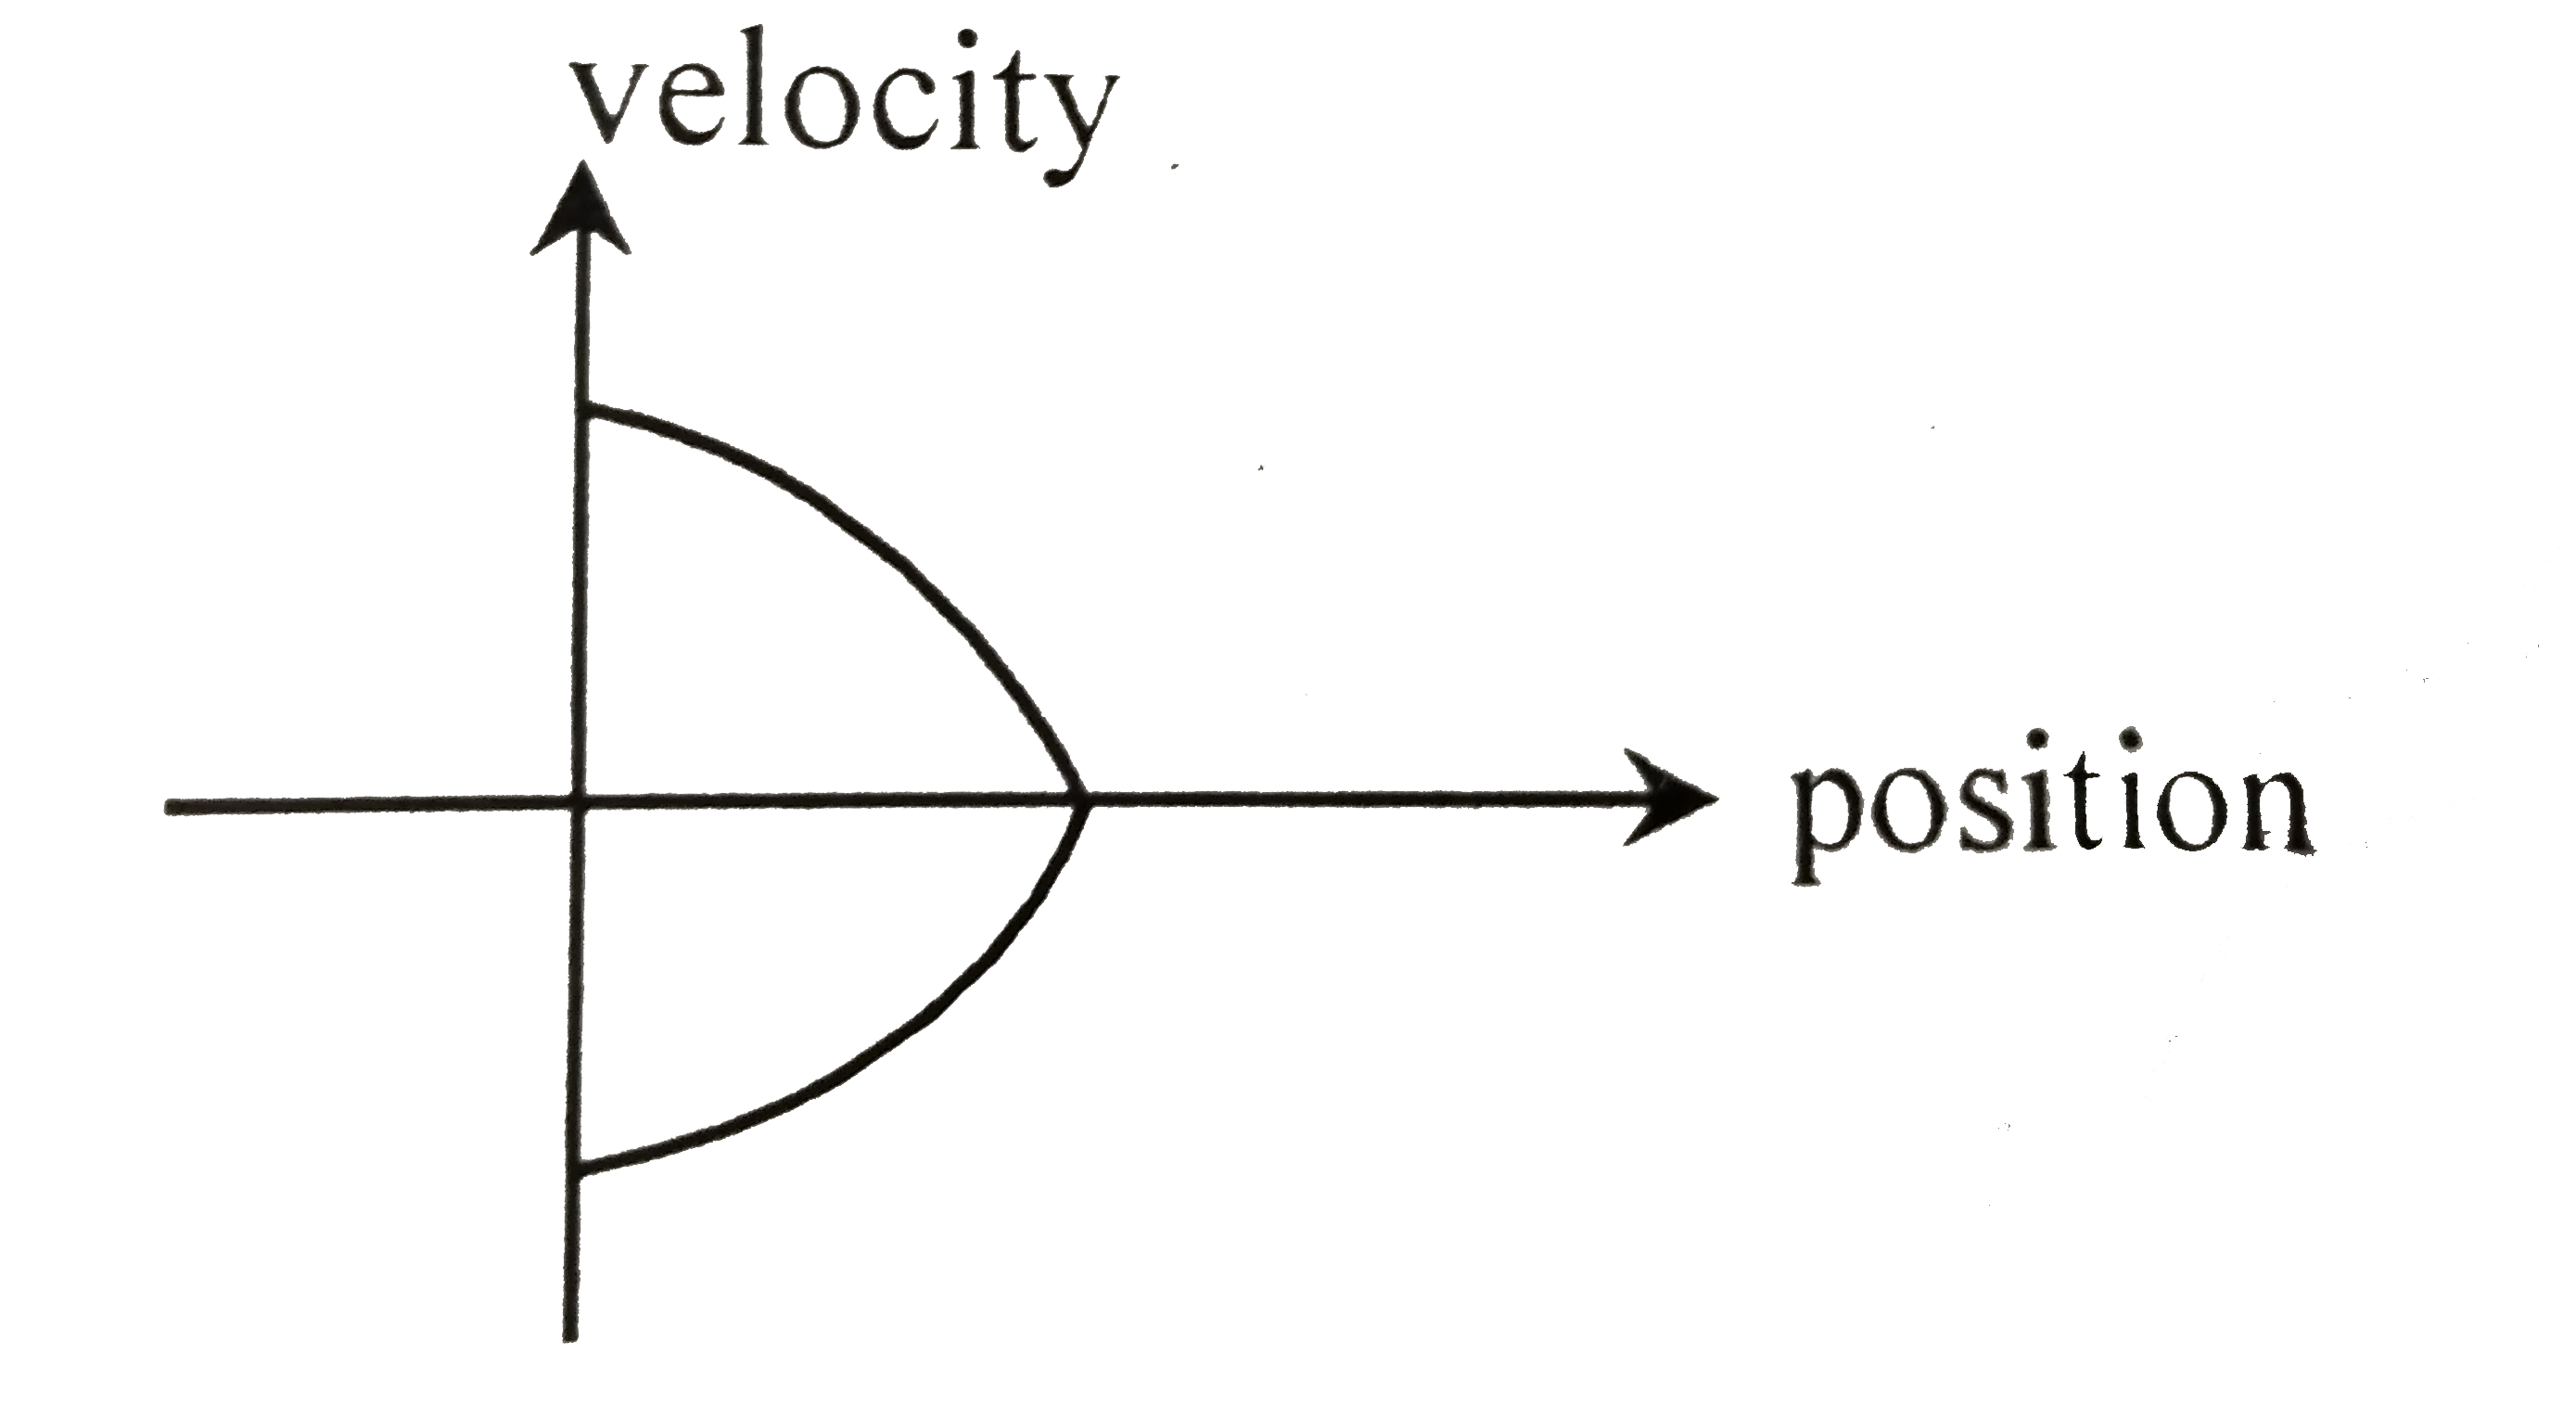
2. **Analyze Option 2:**
- This graph shows two velocities at the same position \( x_0 \): \( v \) and \( -v \).
- This indicates that the particle can be at the same position with two different velocities in opposite directions.
- **Conclusion:** This graph is also consistent with the motion as it allows for a change in direction.
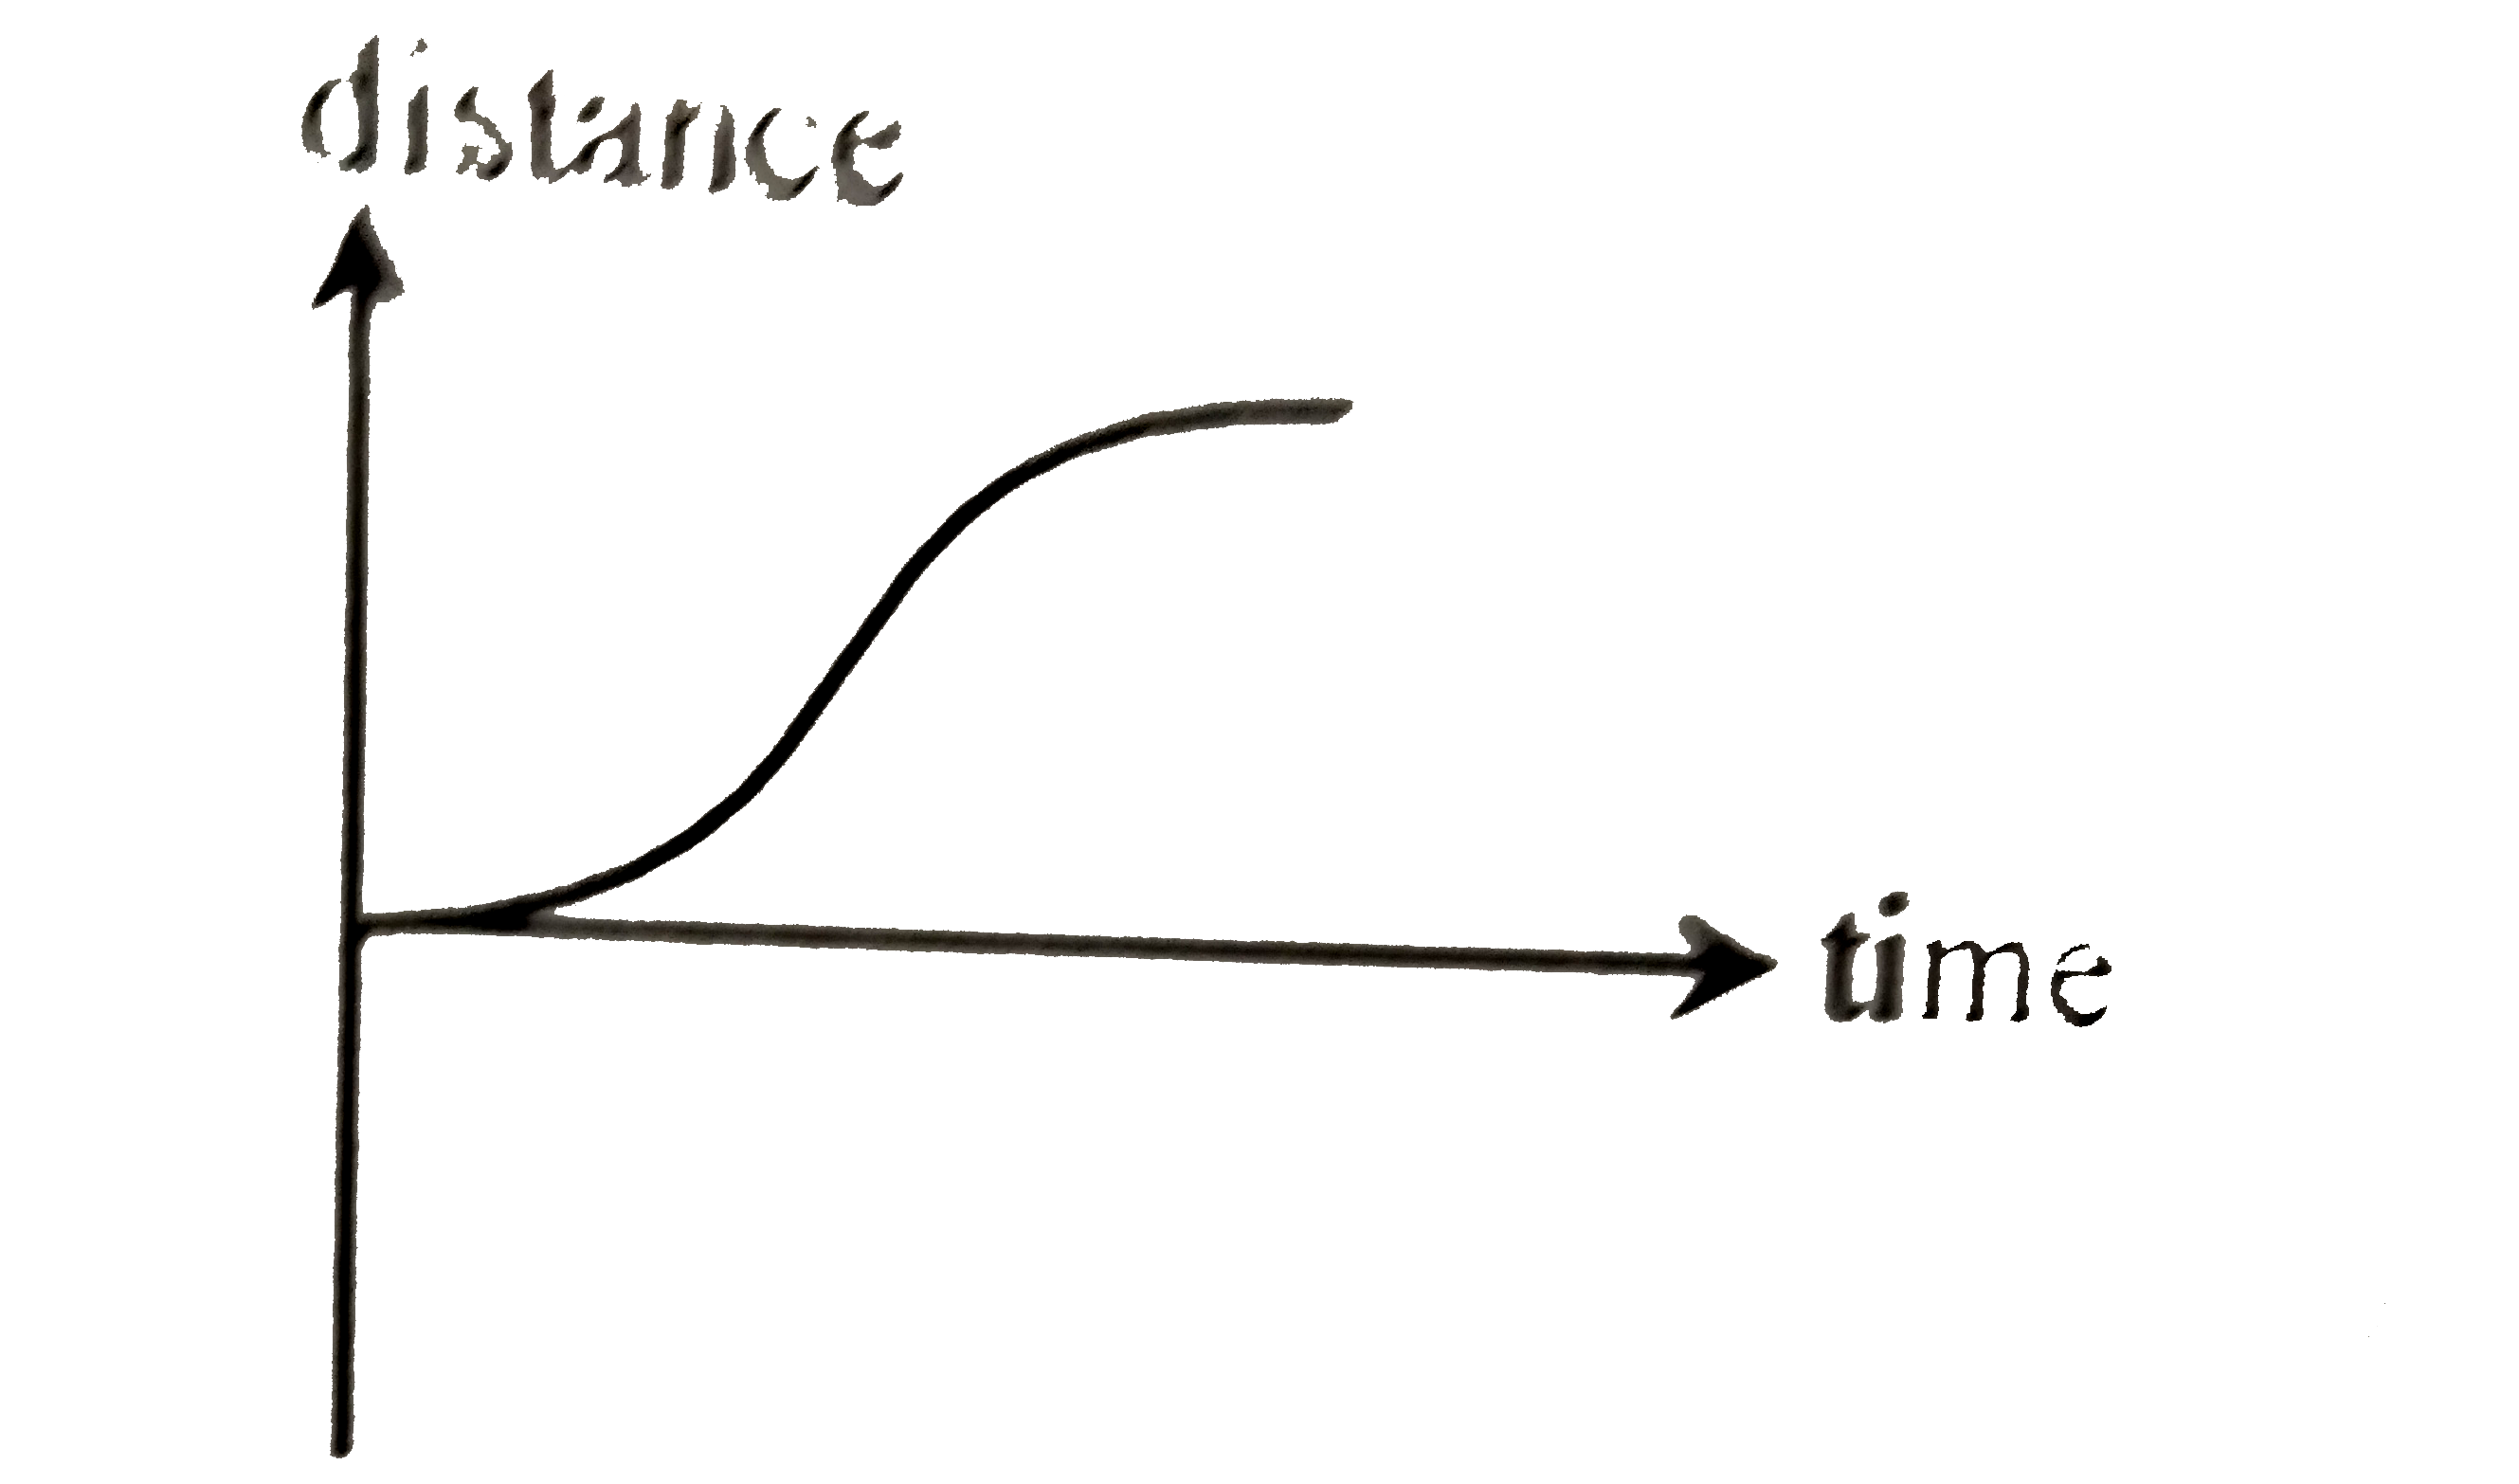
3. **Analyze Option 3:**
- The graph starts with zero velocity (slope is zero).
- It shows a minimum point, indicating that the acceleration is positive until the minimum.
- After the minimum, the graph shows a maximum point, indicating that the acceleration becomes negative.
- The velocity does not become zero again after the initial point.
- **Conclusion:** This graph does not depict a scenario where the velocity returns to zero during the motion, which is inconsistent with the other graphs.
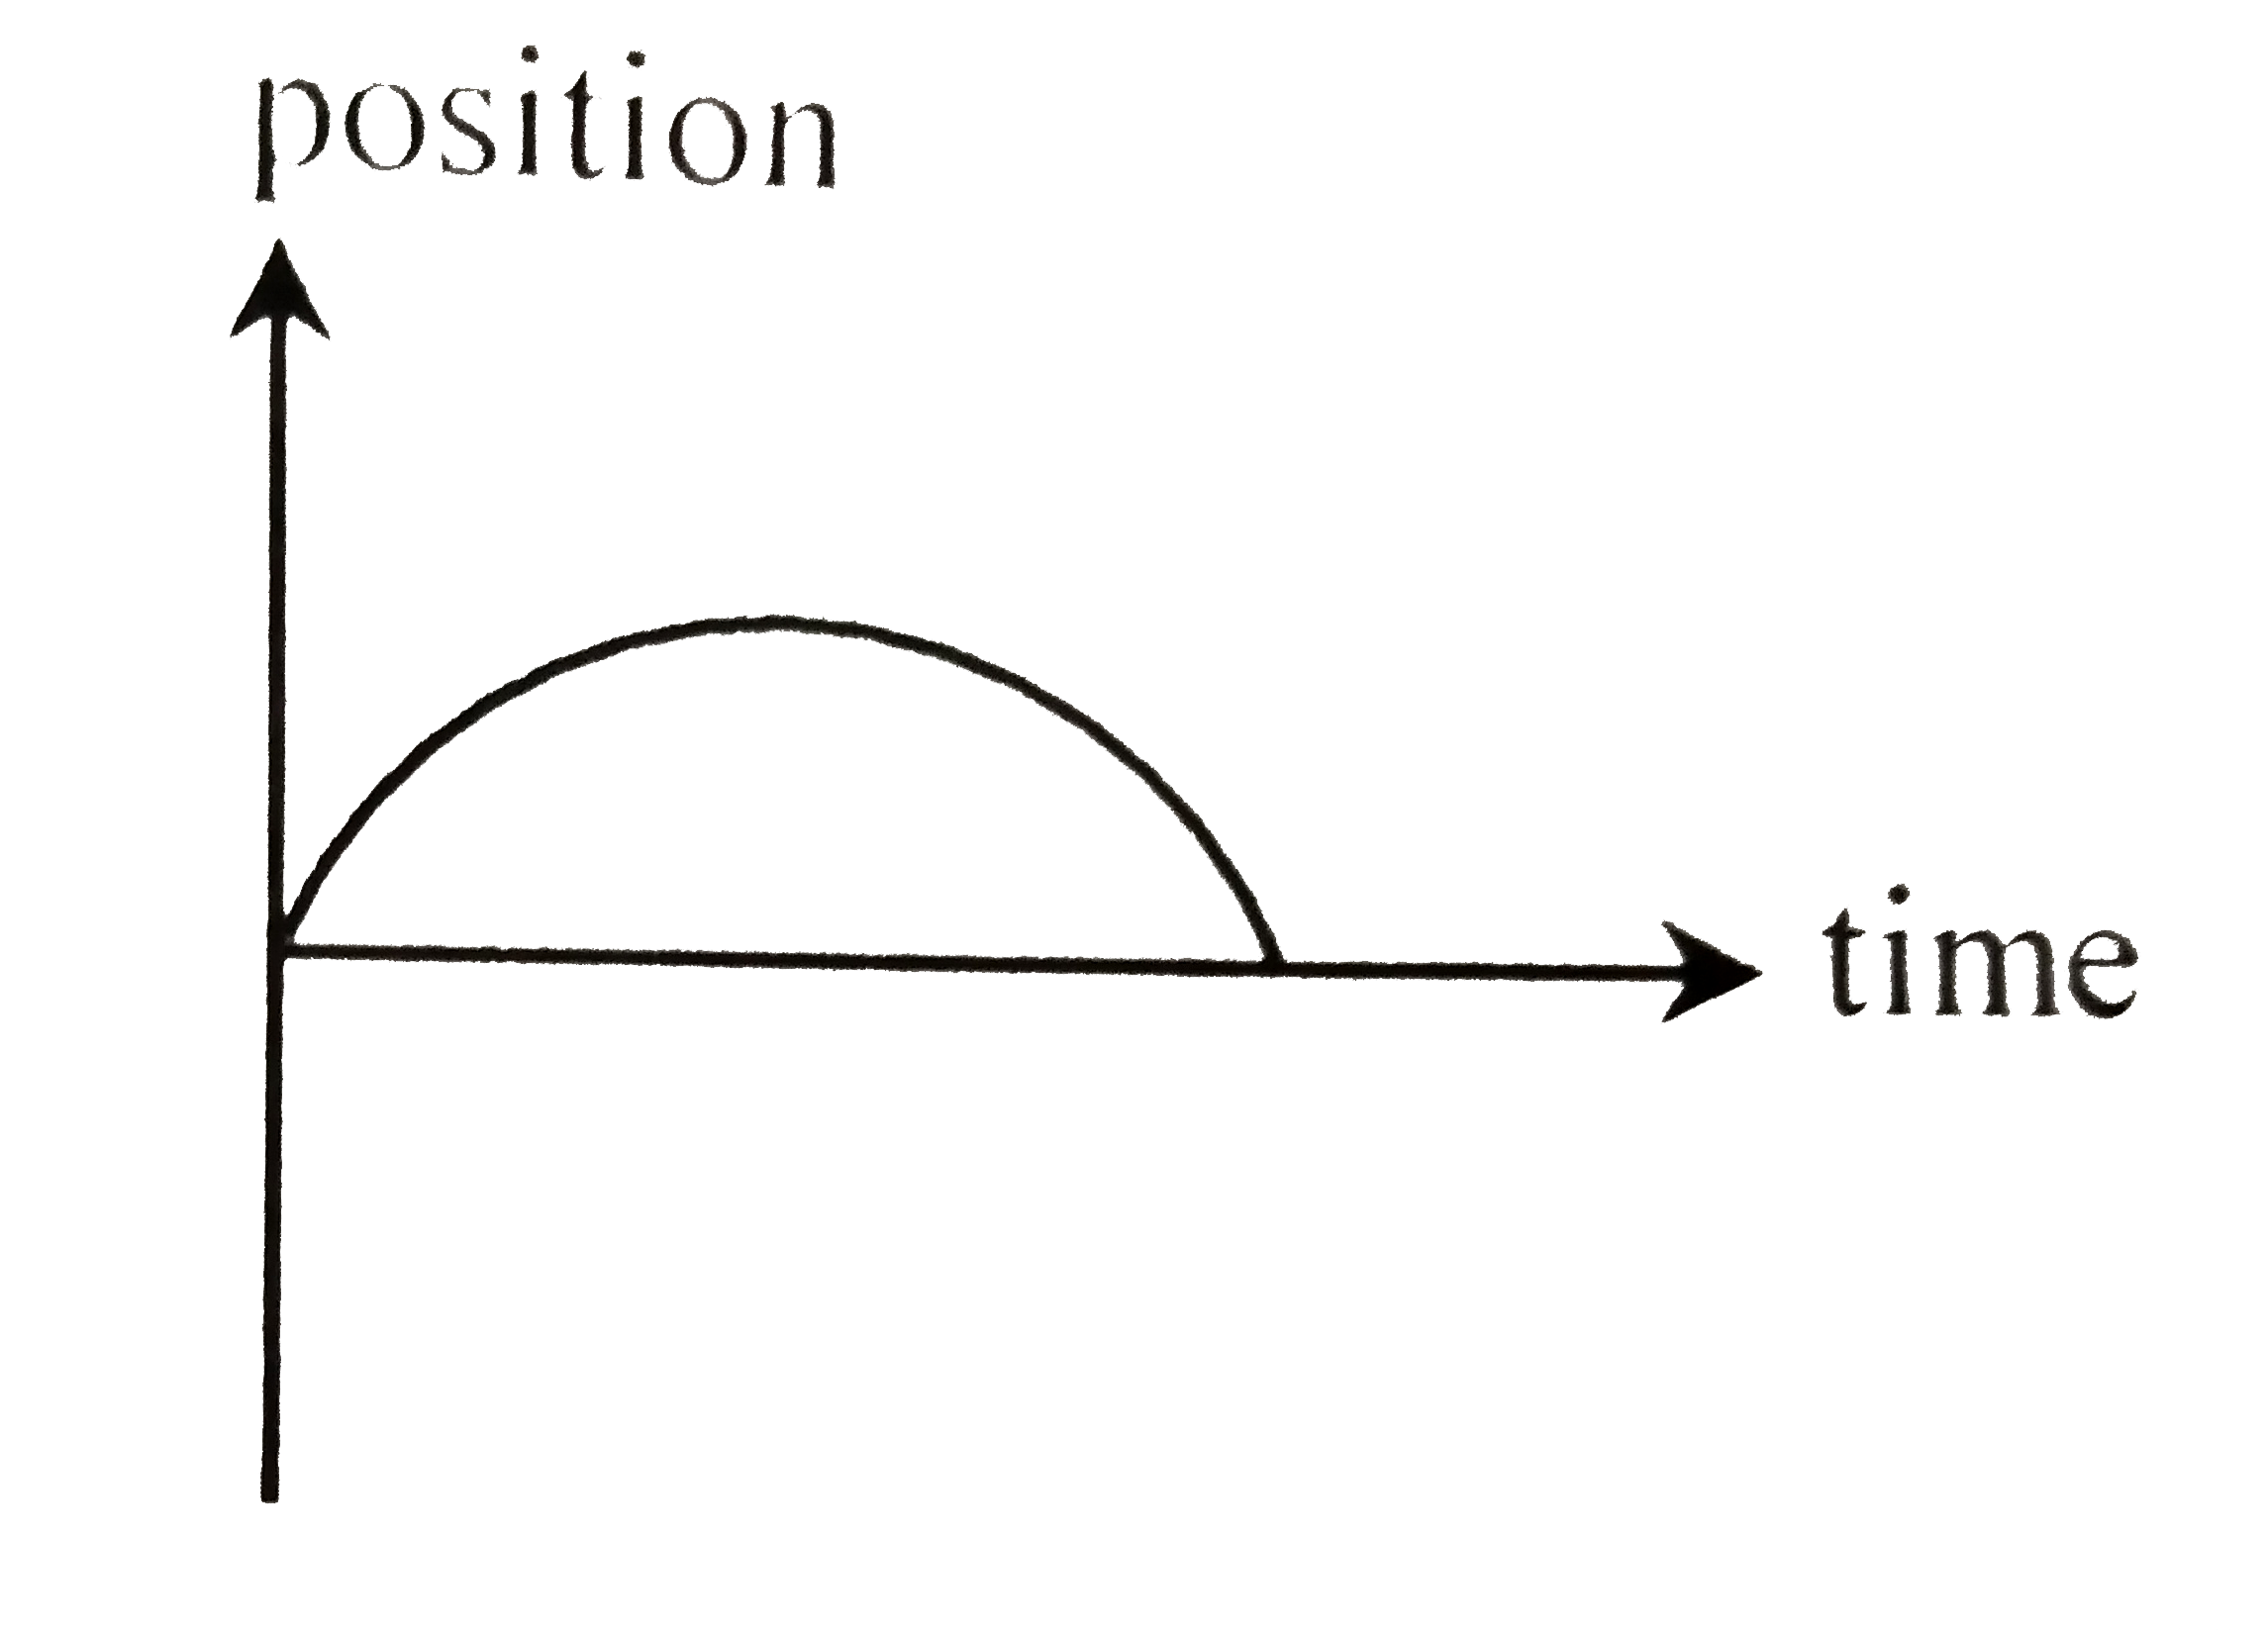
4. **Analyze Option 4:**
- The graph shows a maximum point, indicating negative acceleration.
- The initial slope is positive, meaning the initial velocity is positive.
- At some point, the velocity becomes zero again.
- **Conclusion:** This graph is consistent with the motion of a particle starting with positive velocity and experiencing negative acceleration.
### Final Conclusion:
- **Option 3** is the graph that incorrectly represents the motion, as it does not show a return to zero velocity during the motion, unlike the other graphs.
Topper's Solved these Questions
JEE MAINS
JEE MAINS PREVIOUS YEAR ENGLISH|Exercise Chemistry|1 Videos
JEE MAIN
JEE MAINS PREVIOUS YEAR ENGLISH|Exercise All Questions|452 Videos
JEE MAINS 2020
JEE MAINS PREVIOUS YEAR ENGLISH|Exercise PHYSICS|250 Videos
Similar Questions
Explore conceptually related problems
The graph given below represents the linear equation x+y=0.
The graph given below represents the linear equation x=3.
Which of the following curves does not represent motion in one dimensions?
Which of the graphs shown below does not represent the relationship between incident light and the electron ejected from metal surface ?
Which of the graphs shown below does not represent the relationship between incident light and the electron ejected from metal surface?
Which of the graphs shown below does not represent the relationship between incident light and the electron ejected from metal surface?
Study the charactristics of a population represented in the graphs below. Mark the correct graph that represents the type of selection that this population is likely to undergo
Study the charactristics of a population represented in the graphs below. Mark the correct graph that represents the type of selection that this population is likely to undergo
Which of the following pairs of graphs does not represent the motion of he same particle in the same interval (curves are parabollic) :-
STATEMENT - 1 : The diagram below depicts the path of a person walking to and fro from position A to B to C to D. The distance for this motion is 100 yds. STATEMENT - 2 : For the same diagram below, the displacement is 50 yds STATEMENT - 3 : Position-time graphs cannot be used to represent the motion of object with accelerated motion.
JEE MAINS PREVIOUS YEAR ENGLISH-JEE MAINS-Chemistry