 .
.


Topper's Solved these Questions
Similar Questions
Explore conceptually related problems
SL ARORA-MECHANICS-Exercise
- Show that area under the velocity-time graph of an object moving with ...
Text Solution
|
- Derive the three kinematic equations for uniformly accelerated motion ...
Text Solution
|
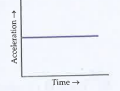
- Acceleration-time graph of a moving object is shown in figure. Draw th...
Text Solution
|
- Draw a graph showing the difference between distance and displacement.
Text Solution
|
- Draw the following graphs (expected nature only) between distance and ...
Text Solution
|
- Draw the following graphs (expected nature only) between distance and ...
Text Solution
|
- The velocity-displacement graph of a particle is shown in the figure. ...
Text Solution
|
- A system is shown in the figure. The time period for small oscillation...
Text Solution
|
- Discuss the motion of an object under free fall and draw (a) accelerat...
Text Solution
|
- Discuss the motion of an object under free fall and draw (a) accelerat...
Text Solution
|
- Discuss the motion of an object under free fall and draw (a) accelerat...
Text Solution
|
- Assertion: Area under velocity-time graph give displacement. Reason:...
Text Solution
|
- Using velocity time graph, establish the relation s = ut + (1)/(2)at^(...
Text Solution
|
- A car moving aling a straight highway with speed of 126 km h^(-1) is ...
Text Solution
|
- Derive an equation for the distance covered by a uniformly accelerated...
Text Solution
|
- Draw velocity – time graph of uniformly accelerated motion in one dime...
Text Solution
|
- Draw velocity – time graph of uniformly accelerated motion in one dime...
Text Solution
|
- Deduce the equations of unifromly accelerated motion in one dimension ...
Text Solution
|
- Define relative velocity of an object w.r.t. another. Draw position-ti...
Text Solution
|
- Define relative velocity of an object w.r.t. another. Draw position-ti...
Text Solution
|