Text Solution
Verified by Experts
The correct Answer is:


Topper's Solved these Questions
Similar Questions
Explore conceptually related problems
NCERT TAMIL-STATISTICS-Exercise 14.1
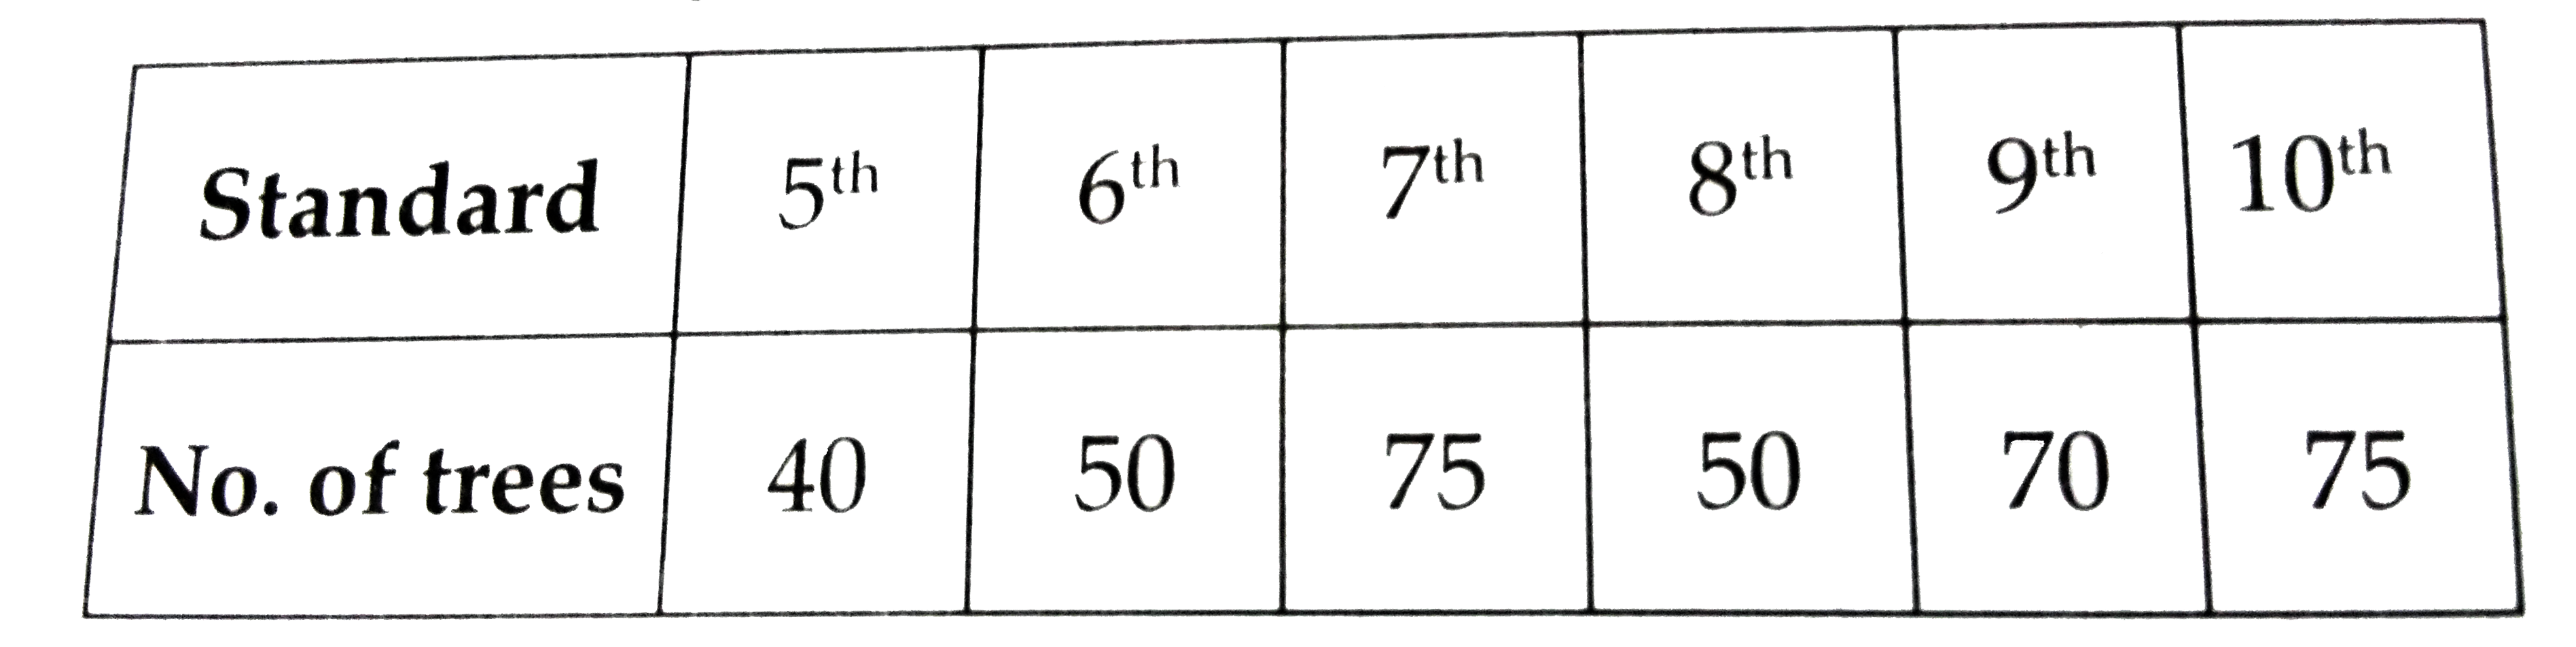
- In a tree plantation programme, the number of trees planted by student...
Text Solution
|
- The following distribution shows the daily pocket allowance of childre...
Text Solution
|
- In the adjacent figure. AC = 6 cm, AB = 5 cm and angleBAC = 30^(@). Fi...
Text Solution
|
- A frequency distribution table for the production of oranges of some f...
Text Solution
|
- The table below the daily expenditure on food of 25 household in a loc...
Text Solution
|
- Fill in the Table:
Text Solution
|
- The marks obtained in mathematics by 30 students of Class X of a certa...
Text Solution
|
- The following table shows the ages of the patients admitted in a hospi...
Text Solution
|