Text Solution
Verified by Experts
The correct Answer is:


Topper's Solved these Questions
Similar Questions
Explore conceptually related problems
NCERT TAMIL-STATISTICS-Exercise 14.2
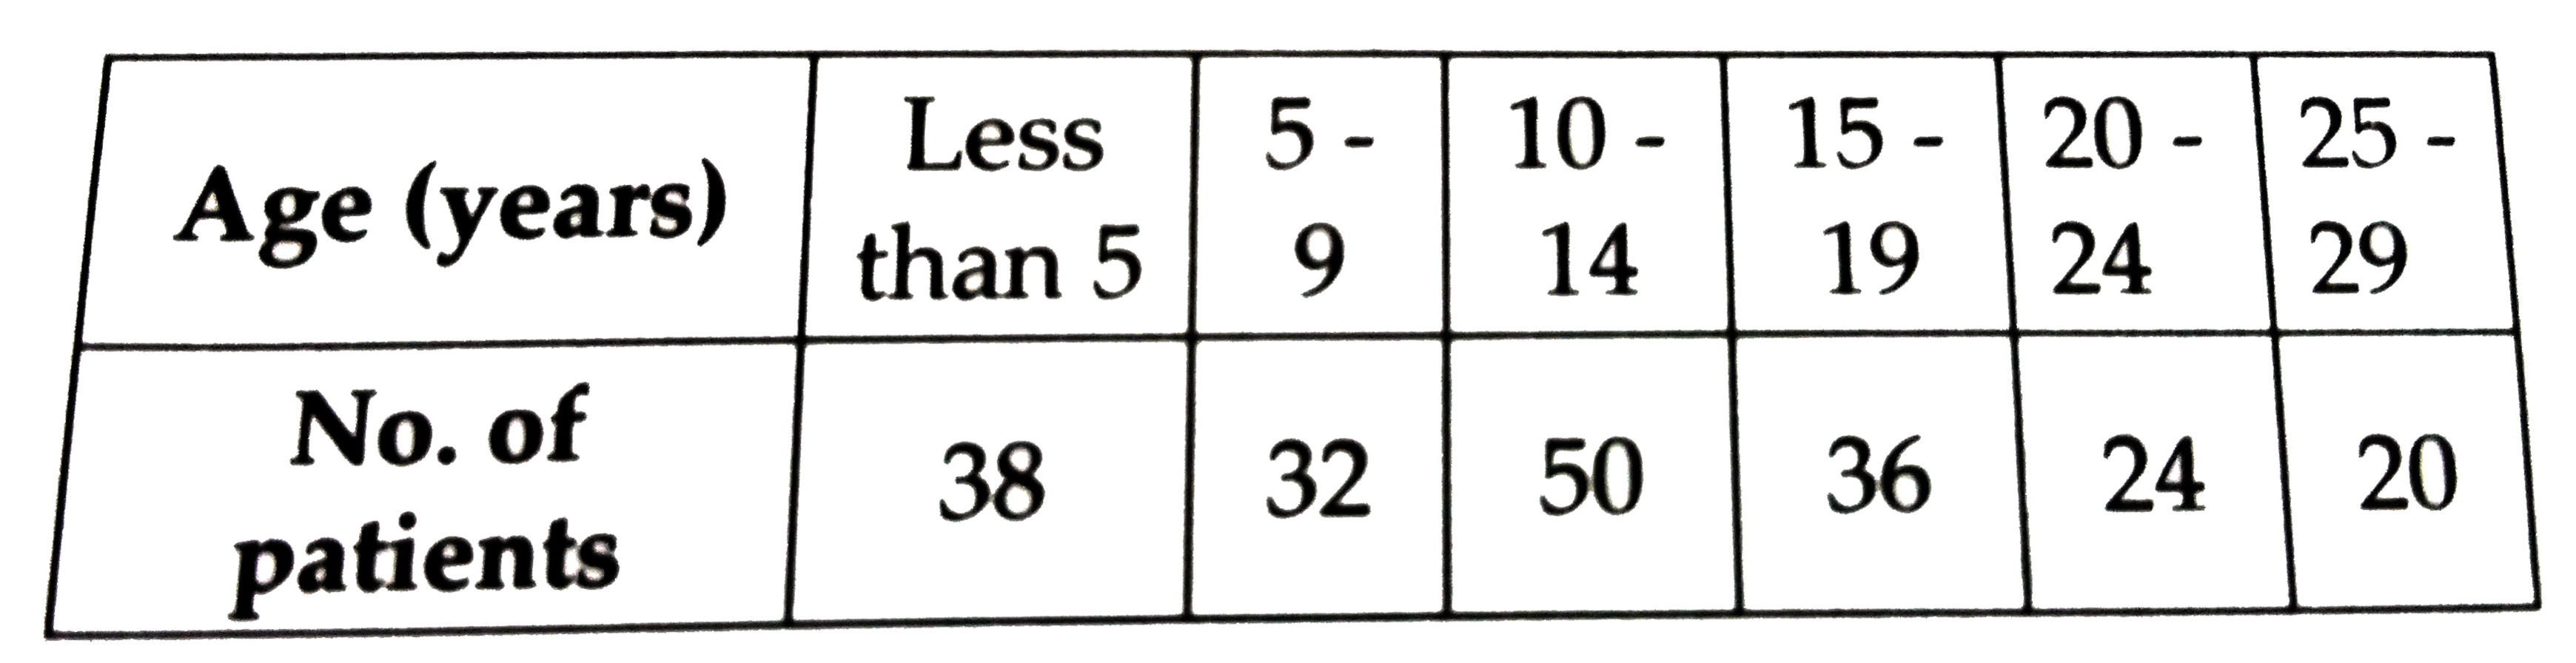
- The following frequency distribution table gives the ages of 200 patie...
Text Solution
|
- The following data gives the information on the observed life times (i...
Text Solution
|
- The following data gives the distribution of total monthly household e...
Text Solution
|
- The following distribution distribution given the state-wise, teacher-...
Text Solution
|
- Matching.
Text Solution
|
- The following frequency table shows the demand for a sweet and the nu...
Text Solution
|