
Text Solution
Verified by Experts


Topper's Solved these Questions
Similar Questions
Explore conceptually related problems
AAKASH SERIES-WORK, POWER & ENERGY -PRACTICE EXERCISE (PERFECTLY INELASTIC COLLISIONS)
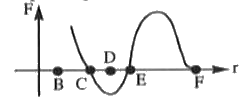
- The given plot shows the variation of U, the potential energy of inter...
Text Solution
|
- A shot moving with a velocity 140 ms^(-1) collides a wooden block and ...
Text Solution
|
- Two particles each of mass m, collide head on when their speeds are 2u...
Text Solution
|
- A body of mass 10 gm moving the velocity 5ms^(-1) collides with anothe...
Text Solution
|
- 10 bullets each of mass 10gm are fired in succession into a block of m...
Text Solution
|
- A truck of mass 1200kg is moving with a speed of 7ms^(-1) when it coll...
Text Solution
|